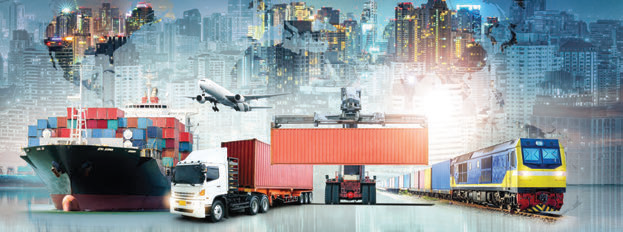
An analysis of the supply chain dynamics of 2021 in global shipping and its impact on logistics, gives a view on how prices are likely to unfold in the upcoming year.
An analysis of the supply chain dynamics of 2021 in global shipping and its impact on logistics, gives a view on how prices are likely to unfold in the upcoming year.
As the year 2021 is coming to its close (at the time of writing there is still a month to go), the S&P 500 or the Dow Jones Index is slated for a YTD projected growth close of 14 per cent, which never could have been estimated at the beginning of the year, given the mix of dampeners, starting from the progress of the Delta variant, followed by the supply chain disruptions taking the commodities and goods in circulation to the stratosphere in terms of prices. The balancing forces of vaccine dosage in the majority of the developed world, including major economies such as China, India and the major part of the developing world outside of Africa, did a commendable job of vaccine administration that dampened the progress of the virus and thus the economic impact could be tempered.
The joker in the pack however is the impact of the supply chain disruptions that continued throughout 2021 and the tip of the iceberg seems to be the global shipping puzzle that has taken the Shanghai Containerized Freight Index to the hilt (almost three times the value at the beginning of pandemic) together with Baltic Dry Index as well. The challenge is that both these seem to be staying at high levels despite a bunch of the other indices tapering off.
Running a tight ship
The global shipping puzzle needs to be deciphered, if one has to understand the future trajectory of commodity prices, which could well influence the movement of prices of intermediate goods and final goods, well into 2022.
It all started with a sharp drop in trade and global flows from systemic demand and supply shocks have several levels of supply chain disruptions to be understood.
The first line is the disruption from commodity to semi-finished goods and finished goods through assembly and manufacturing processes and from there through the distribution network to the end markets that stemmed from simple storage. Here, there are typically three dislocation points that are supposed to act as buffers, commodity storage, warehousing of finished goods and finally the storage points at the distribution centers. All the three buffers move through the push-pull global systems and keep on adjusting to the new information, flow of physical goods, absence of flow, flow of capital and labour as well.
The second line of flow is the transportation leg itself. Here the starting point is bulk shipping, moving to unit shipping and finally to flows into urban centers of consumption (last mile). The bulk shipping size change in parcels creates havoc to this flow to the final consumption point through cascades that impact storage and distribution principles in the first line.
Demand-supply correlative
The last line is also to see the supply shock, demand shock and distribution constraints fully blown up into the disruption ambit through some discernible patterns coming from the pandemic itself:
- Supply shock: Lack of raw material at the right time, lack of parts at the right time and lack of manpower at the right time
- Demand shock: Rise of hoarding, drop in demand and proliferation of substitution
- Distribution constraints: Trade regulations, lack of workforce, closing and opening of facilities, varying speed of execution
The first fallout of these three is the rise of the bullwhip effect across the length and breadth of the chain.
The retailers continued to tune their order patterns to every discernible signal, the supply side response kept on changing in varying degrees based on changing capabilities to serve. All sides had varying degrees of access to financing; the might of financing by large retailers pulled in is proportionate volumes to their advantage, raising empties at various dislocation points.
Size matters
All this time the shipping lines and the port handling facilities acted fast to respond to the shock. The experience of the 2008 crisis had helped to decipher the puzzle – consolidation of shipping line capacity, together with the Port handling capacity, was crucial for survival.
Even if you think of those top ports that carry more than 10 million TEUs, the ship size increase has been of the order of 25 per cent. This massification of ships is at the root of the shipping mismatch problem.
A large ship that carries more containers has many advantages, mostly related to costs, but it comes with accompanying challenges of asynchronism, as parcels have to aggregated and dis-aggregated on both sides, the port handling facility has to be augmented, land parcel logistics has to be tied, many intermediaries have to be integrated together with the informational aspects; not all of this can adjust to a much larger batch size of container-shipment. If flows increase to large bulk terminals with only bulk ships and no feeder traffic, the hub and spoke model could intensify in certain directions influencing global flows as well.
However, more interestingly the Covid-19 disruption has shown some very interesting facts how the carrier consolidation, together with Port Handling Assets consolidation created a giant consortium that facilitated larger parcel volume, pushing the logistics disruption to a singular direction of un-ending asynchronism.
Advantage technology
Any dislocation in global trade, stemming from a recession in the past, has seen a somewhat much lower level of coordination among the carrier and port handling asset space. Take the 2007-08 global crisis and not even 15 per cent of the total container shipping space was controlled by the top 10 carriers. The Port Terminal handling consolidation is also not to be lost sight of; 41 per cent was held by the top 10, to 74 per cent now.
The crisis created a bloodshed of sorts as smaller carriers-terminal handling operators could not cope up with the challenges and either declared bankruptcy or were forced into consolidation space through acquisitions. The culmination of this is seen in the late 2020 picture of shipping carrier space, together with Port Terminal Handling assets, when 90 per cent of container volume is consolidated in the strongholds of the top 10 carriers. But consolidation alone is not the only point, the real breakthrough came from technology absorption that allowed sharing of containers among the carriers to fill up larger ships.
Larger ships have the unique advantage of not only higher fixed cost absorption, it also saves on fuel as the speed reduction gives further gains. Think of a single container picked up from mainland China and is moved to the port of Shanghai and is moved through a 22,000 container vessel to Los Angeles, the logistics cost of this movement will be 40 per cent lower just from the massification and speed advantage. If carriers consolidate, together with port handling asset consolidation, the pass through of these costs to the price that retailers have to pay cannot be arrested.
Much of what is blamed on supply chain disruption is actually a combined effect of this phenomenon driven by consolidation at a massive scale, together with massification of container and shipping parcel per ship.
The year 2022 will continue to see these influences impacting prices as logistics cost will stay high in the foreseeable future.
Procyon Mukherjee








 Concrete4 weeks ago
 Concrete2 weeks ago
 Concrete2 weeks ago
 Concrete4 weeks ago