Connect with us

Economy & Market

When Ash Sticks, Everything Stops

Published

on

Shares

Jigar Shah, Head – Application Engineering, ACM SBU, Henkel Adhesive Technologies India, looks at the smarter way to keep power flowing.

In cement manufacturing, where uptime is everything, captive power plants are the backbone of uninterrupted operations. But even the most robust systems can be brought to a halt by something as deceptively simple as ash.
Ash buildup—especially in high-humidity environments—is a recurring challenge for maintenance teams. It clings to the inner walls of hoppers and silos, chokes flow paths, and forces shutdowns that no one has time for. And when the monsoon rolls in, the problem only intensifies.
This is the story of how one thermal power plant in India tackled the issue—not with more manpower or heavier hammers, but with a surface engineering solution developed by Henkel’s Loctite team. The application of Loctite® PC 7337 Anti-Stick Coating helped the plant shift from reactive maintenance to preventive control, restoring flow and reliability where it mattered most.

The sticky truth
Ash is an inevitable by-product of coal combustion. In captive power plants, fly ash is collected in electrostatic precipitators (ESPs) and directed to ash hoppers. Bottom ash, meanwhile, is sluiced with water into Hydrobin tanks—large cylindrical silos where solids settle and water is drained off for further treatment.
In theory, it’s a straightforward process. In practice, it’s anything but.
Ash particles are fine, abrasive and hygroscopic. They absorb moisture from the air, especially during the rainy season, and form stubborn layers on metal surfaces. Over time, this buildup narrows flow paths, increases system pressure, and eventually brings operations to a standstill.
At the plant in question, maintenance teams were routinely forced to shut down operations to manually clear out ash deposits. Sometimes that meant hammering on hopper walls. Other times, it meant full system stoppages. Either way, the cost—in time, labour and lost production—was significant.

A new approach
Rather than redesign the system or increase maintenance frequency, the plant’s engineering team explored a different path: surface modification.
They partnered with Henkel’s Application Engineering team to trial Loctite® PC 7337—a polymer-based anti-stick coating designed specifically for abrasive, high-moisture environments. The goal was simple: prevent ash from sticking in the first place.
Loctite PC 7337 was applied to the internal surfaces of the Hydrobin tank and ash hopper. The coating offered a low-friction, hydrophobic barrier that repelled fine particles and resisted wear. But as with any industrial solution, success depended on proper preparation and execution.

Application in action
The coating process followed a meticulous five-step protocol:
1. Surface preparation: Initial cleaning involved the removal of oil, grease and other contaminants. Abrasive blasting followed, creating a surface profile of 40–60 microns to ensure strong mechanical bonding.
2. Dust removal: All residual dust was cleared to prevent contamination and ensure a clean substrate.
3. Coating application: Loctite PC 7337 was mixed and applied to a wet film thickness of 200–250 microns. No heat curing was required—ambient conditions were sufficient.
4. Curing: The coating was left to cure for 24 hours, forming a durable, glossy finish.
5. Inspection: Final checks included dry film thickness measurement, visual inspection and holiday detection to confirm coating integrity.
The result? A smooth, frictionless surface that ash simply couldn’t cling to.

Real-world results
Post-application, the plant saw immediate improvements. Ash no longer adhered to the coated surfaces, even during peak humidity. Flow paths remained clear, and the need for manual cleaning dropped dramatically.
Here’s what changed:
• Fewer shutdowns: With ash buildup under control, unplanned stoppages became a thing of the past.
• Improved flow efficiency: Material moved more freely through the system, reducing pressure fluctuations and wear.
• Regulatory compliance: The plant was able to meet its monthly ash disposal targets, aligning with environmental mandates from the National Green Tribunal (NGT).
• Cost savings: Reduced maintenance and downtime translated into measurable financial benefits.

Why it worked
The coating’s performance came down to two key properties: abrasion resistance and hydrophobicity.
In lab tests, Loctite PC 7337 showed excellent wear resistance, losing only 9 mg after 1000 cycles under a 1 kg load using CS-17 wheels (ASTM D4060). That’s critical when dealing with fine, abrasive particles like fly ash and clinker dust.
Equally important was its ability to repel moisture. The coating’s low surface energy and high contact angle created a hydrophobic barrier that prevented wet ash from bonding to the surface—a common failure point for traditional coatings.
It also proved effective across a wide range of particle sizes. From cement fines under 45 microns to pulverized coal (79–120 microns) and clinker dust (3–30 microns), Loctite PC 7337 maintained its anti-stick properties. Even particles up to 1 mm showed only moderate adhesion during internal trials.

Beyond power plants
While this case focused on a thermal power plant, the implications for cement manufacturing are clear. Many of the same challenges—fine particle buildup, moisture-induced sticking, and flow disruptions—occur throughout the plant.
Potential applications for Loctite PC 7337 include:
• ID fan coatings: To prevent dust accumulation and maintain airflow efficiency.
• Pump linings: To reduce wear and improve slurry flow in wet handling systems.
• Silo and hopper interiors: To prevent bridging and rat-holing in cement and fly ash storage.
• Chutes and ducts: To enhance flow and reduce maintenance in pneumatic conveying systems.
By proactively addressing surface behaviour, cement plants can reduce maintenance burdens, extend equipment life, and improve process reliability.

A shift in mindset
This project highlights a broader shift in industrial maintenance philosophy—from reactive fixes to preventive strategies. Instead of waiting for problems to arise, forward-thinking plants are investing in solutions that stop issues before they start.
Surface engineering, particularly with advanced coatings like Loctite PC 7337, is a powerful tool in this shift. It allows operators to tailor equipment surfaces to their specific material and environmental challenges, rather than relying on generic designs or brute-force maintenance.
And while the coating itself was a key enabler, the real success came from collaboration. The plant’s willingness to try a new approach, combined with the technical support of Henkel’s Loctite team, created a solution that was both practical and scalable.

Small change, big impact
Sometimes, the biggest operational wins come from the smallest changes. In this case, a 250-micron of Loctite PC 7337 made the difference between constant maintenance and consistent performance.
For cement plants navigating the complex demands of energy efficiency, environmental compliance, and cost control, solutions like these offer a compelling path forward. They’re not flashy. They don’t require massive capital investment. But they work—and they work where it counts.
Because when ash sticks, everything stops. And when it doesn’t, everything flows.

ABOUT THE AUTHOR:
Jigar Shah, Head – Application Engineering, ACM SBU, Henkel Adhesive Technologies India, has 20+ years of experience. He drives efficiency and sustainability through innovations.


Economy & Market

From First Mile to Last Mile

Published

on

By

Shares

Praveen Vashistha, Founder, Gxpress Solutions, speaks about building a holistic logistics network that encompasses latest technology and current challenges faced by logistics service providers.

Logistics may seem to only entail transporting a package from one location to another. However, there is more to this term than just that. Logistics refers to the entire process of controlling all movement, transfers and decisions in the correct way at the right time and cost and with the desired level of visibility.

People nowadays want to receive more than just the delivery. They want quick, efficient, reliable and transparent logistics service. On the other hand, companies are facing higher operating costs, broken supply chains, congested cities, changing habits of consumers and growing complexity of logistics services. In this situation, a full logistics package is gaining importance not only as a competitive advantage but also as a necessity for a successful business.

The main challenge lies in uniting the first mile, the middle mile and the last mile into one seamless process.

The journey begins before the package moves

First-mile logistics may be the least recognised part of the logistics chain, but they have a crucial influence on all that follows.

This stage starts from the moment the shipment leaves the manufacturer, supplier, farm, warehouse or distribution centre. Depending on the industry, first-mile logistics may involve grouping shipments from multiple suppliers, compiling paperwork and checking the inventory before sending the shipments to a central hub.

Flaws in first-mile logistics produce effects later down the supply chain. Delays in cargo pickup can affect warehouse operations; improper packaging can damage goods in transit; and incorrect inventory information may cause stockholding or unnecessary replenishments.

This is why building a reliable network involves simplifying the operations done at the beginning of the supply chain.

Companies require accurate demand forecasts, supplier visibility, standard procedures, and software to capture information from the moment a shipment enters the supply chain. Route planning and fleet management are also important at this stage, especially as it may involve contacting multiple suppliers.

The main goal is simply to make the first mile predictable.

The middle mile: Where scale meets complexity

When products leave the original site, they travel through the ‘middle mile,’ which connects fulfilment centres, warehouses, sorting centres, and regional distribution points. In this phase, logistics networks begin operating on a large scale. A shipment can pass through several facilities before reaching the final destination. Each additional transfer entails the risk of delay or damage and information losses. Accordingly, the ideal solution is not to minimise the number of transfers but rather to optimise them. The use of hub-and-spoke networks, regional distribution centres, and strategically placed distribution centres can help companies shorten transportation routes and optimise distribution costs. Besides, data can be used to determine the optimal placement of inventories.

For instance, a retailer may find that it takes more time and is more expensive to deliver goods to customers if everything is stored in a central warehouse. Meanwhile, regional distribution helps meet the customer’s needs quicker and more efficiently.

The last mile is where the customer judges you

When it comes to the logistics experience, the customer experience comes down to the delivery. While the last mile might comprise a small part of the entire journey in actual distance, it could also entail expensive and difficult processes. Delivery runs through densely populated cities, through traffic jams, through unsuccessful delivery attempts, and through changing consumer preferences and narrowed time frames.

Customers want to have control over their delivery. Delivery means that customers expect to know the exact moment when their order is delivered. They need to receive current updates about their orders and the ability to decide whether they want scheduled deliveries, or whether they want their order to be dropped off at a designated location far from their house.

As a result, last-mile logistics must incorporate both efficiency and experience. The technology may be used to ensure timely and accurate delivery, through such products as route optimisation and real-time delivery tracking.

However, technology is not enough to guarantee success in terms of last-mile delivery. Knowledge of the local area is still an important aspect that contributes to successful delivery.

One network, not three separate operations

First, the common mistake that organisations can make is treating the first mile, the middle, and the last mile separately.

An effective first mile of logistics does not matter much if the shipment waits in a hub for many hours. A perfectly working warehouse does not make a happy customer if the last-mile delivery fails. Therefore, even the fastest last-mile delivery can become an expensive operation if the supply is not well geographically positioned.

The three moments should work together as one whole system.

This implies having a common view on inventory, transport capacities, shipment statuses and demand. The Transportation Management System, Warehouse Management System and order management system should give information to each other instead of acting like separate islands.

That is where real-time information comes into play!

If something happens, such as a vehicle gets delayed, the company has to know that from the start. If not, someone from Customer Service should be informed about the situation.

Visibility is the new infrastructure

Previously, companies had to rely on physical assets, such as warehouses, trucks, and sorting facilities, to create their logistics networks. Today, they have an additional layer of technology providing visibility.

Command-and-control systems now include GPS tracking, Internet of Things devices, bar-coding, RFID, cloud computing, artificial intelligence, and analytics, which allow companies to know what the goods are doing, how well they are doing, and what is going to happen next.

Predictive analytics reveal possible delays. AI-powered forecasting increases availability. Digital dashboards enable the manager to monitor all operations in one place. The efficiency of such technologies is not measured in the amount of information they gather, but rather in their capability of converting data into knowledge.

Logistics managers should be able to answer the following questions: Where is it? When is it supposed to arrive? What causes the delay? What impact does it have? Can it be delivered some other way? How much will it cost?

The sooner the answers are given, the more resilient the logistics system is.

Resilience must be designed into the network

The events of recent years have highlighted the vulnerability of interconnected supply chains. Geopolitical tensions, bad weather, a lack of labour, poorly developed infrastructure and an unexpected spike in demand are some events that can cause problems for logistics systems without prior notice. Thus, companies should create an end-to-end network not just for normal times but also capable of functioning quickly in problematic situations. In order to create such a network, it is necessary to find alternative suppliers, use several means of transportation, create several routes of delivery, and establish inventory. It is also important to use scenario planning to define what to do if the main hub becomes unavailable or any means of transportation is blocked.

Sustainability: Part of the delivery equation

The future of logistics will also be shaped by environmental considerations.

As delivery volumes rise, businesses are under increasing pressure to reduce emissions without compromising service. Better route planning, load optimisation, electric vehicles, alternative fuels, renewable-energy-powered warehouses and consolidated deliveries can all contribute. The most sustainable shipment is often the one that does not require unnecessary movement in the first place.

Better demand forecasting and inventory placement can reduce empty miles and avoid repeated transportation. Consolidating deliveries can improve vehicle utilisation. Reverse logistics can ensure that products, packaging and materials return efficiently instead of becoming waste.

Sustainability, therefore, should not be treated as a separate initiative. It should be incorporated into network design itself.

The future belongs to connected logistics

An end-to-end logistics network ultimately seeks to close existing gaps between various processes.

Every mile of the process should be interconnected with the other miles. Warehouses should be aware of the restraints imposed by transportation. Delivery crews should be able to know at every moment the inventory at their disposal. Clients must have access to this useful information.

Companies that will be successful in this area will not necessarily be the ones with the biggest fleets or the most warehouses. They will simply be the ones that can employ their resources in the most effective manner.

The future of logistics will be represented by an ecosystem consisting of the combination of the physical aspect, digital intelligence, and personnel decisions. Every mile in the process of delivery is important. However, the key advantage here is getting those miles to work together.

For companies, it means having minimal resistance, enhancing their efficiency and improving customer care. For clients, it means simply having the right product delivered at the right time.

About the author: Praveen Vashistha, Founder, Gxpress Solutions,

Continue Reading

Concrete

UltraTech Cement expands green logistics with 600+ electric truck fleet

Published

on

By

Shares

The e-truck fleet will be used to transport five million MT of clinker and other key materials with potential of over 1,17,000 tonnes of net annual CO₂ reduction, displacing the equivalent of 39 million litres of diesel per year.

Mumbai

UltraTech Cement Limited, an Aditya Birla Group company and the world’s largest cement company by sales volume and capacity outside China, has announced that it will scale up its electric vehicle fleet in its logistics operations to 600+ EV trucks by December 2026.

UltraTech has signed service contracts with leading EV prime mover manufacturers including Tata Motors, Ashok Leyland, IPLTech, Energy in Motion and Sany, along with their subsidiaries and other third-party logistics providers, to deploy EV trucks.

The total fleet of 600+ EV trucks will transport about five million MT of clinker and other key materials per annum across Gujarat, Uttar Pradesh, Madhya Pradesh, Rajasthan, Chhattisgarh, Maharashtra and Odisha. Once fully operational, this fleet of over 600 EV trucks will enable a net annual CO₂ reduction of more than 1,17,000 tonnes, displacing the equivalent of 39 million litres of diesel per year.

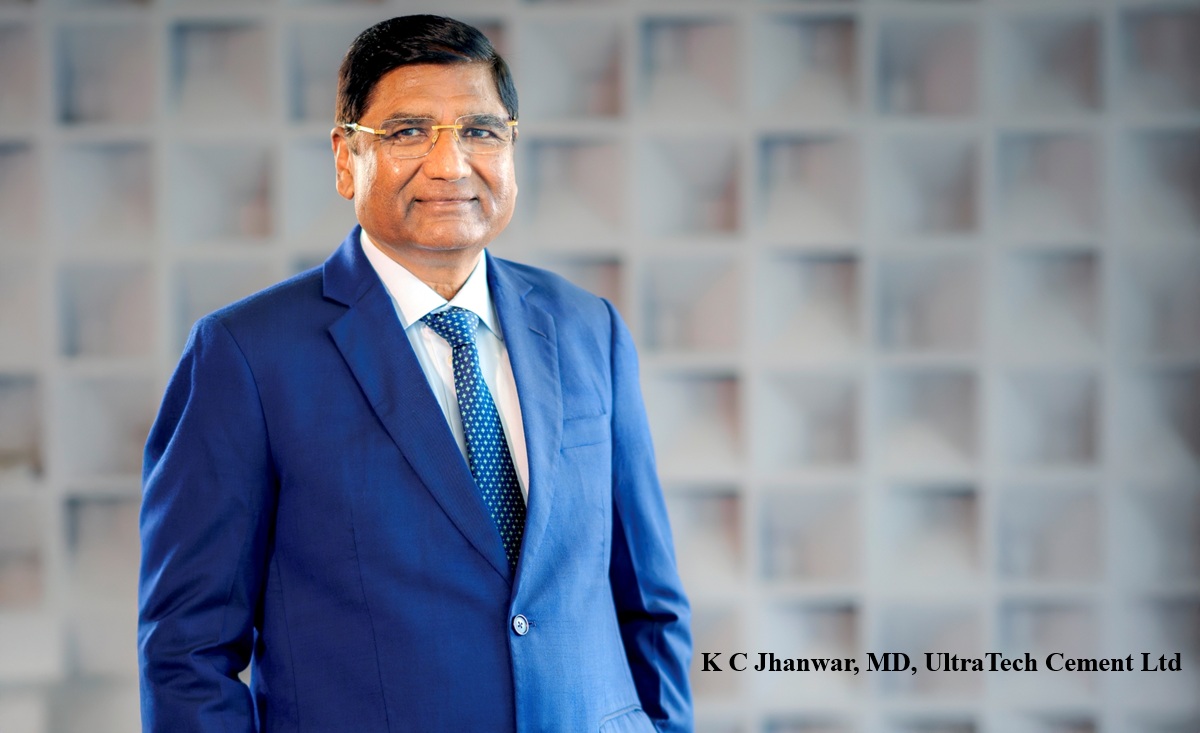
K C Jhanwar, Managing Director, UltraTech Cement Limited, said, “UltraTech is expanding sustainability beyond its plants by adopting greener logistics solutions. This large-scale transition to green logistics underscores our focus on decarbonising every link of our value chain and supports our commitment to achieving Net Zero.”

UltraTech has been a pioneer in advancing sustainable transport in the cement sector, being the first cement company to deploy heavy-duty electric trucks for long-haul transport of clinker and other materials at scale. The company was among the first in India to introduce green logistics, deploying CNG trucks in 2021 and electric trucks in 2024. UltraTech currently operates 850+ trucks as part of its green logistics operations, including CNG and electric trucks.

UltraTech, with a grey cement capacity of over 200 MTPA in India, operates one of the country’s most complex logistics networks. Its electrification strategy covers the entire supply chain—from mine-to-plant movement to inter-plant transport of clinker and other key materials.

The $ 10 billion UltraTech, the cement flagship company of the Aditya Birla Group, has a total Grey Cement capacity of 205.5 MTPA and White Cement/Putty capacity of 3.2 MTPA. It is a signatory to the GCCA Climate Ambition 2050 and has committed to the Net Zero Concrete roadmap announced by GCCA.

Continue Reading

Concrete

Protect Your Margins

Published

on

By

Shares

In a research-backed article, Dr SB Hegde examines why carbon-adjusted profitability and LC3 will decide the next set of winners in cement manufacturing.

The Indian cement industry has achieved world-class operational efficiency through lower specific energy consumption, high plant utilisation and a reduced average clinker factor of approximately 67.5 per cent. These traditional measures of operational excellence remain essential. However, they are no longer sufficient. Carbon now carries a measurable financial cost under India’s Carbon Credit Trading Scheme (CCTS) and under European carbon markets. Future leadership will be defined by carbon-adjusted profitability, the ability to generate strong returns while systematically lowering the carbon intensity of every ton sold.
Limestone calcined clay cement (LC3) offers a practical, scalable pathway to achieve this dual objective. By replacing up to 50 per cent of clinker with calcined clay and limestone, LC3 can reduce CO2 emissions by 30–40 per cent while delivering comparable or superior durability performance.
This article examines the technical foundations of LC3, European industrial practices, the emerging Indian carbon market and a concrete roadmap for Indian companies to embed carbon-adjusted metrics and LC3 into daily operations, incentives and commercial strategy.

Limits of traditional operational excellence
For many years, plant performance has been judged primarily by five indicators: specific heat consumption, specific power consumption, kiln and mill utilisation, clinker factor and overall equipment effectiveness. These metrics drove continuous improvement and helped the industry reduce energy use and increase the share of blended cement. Three structural changes have rendered them incomplete as sole measures of success.
First, carbon now carries a real or opportunity cost. Plants that improve volume or lower cash cost while raising or stagnating emissions intensity create a hidden liability that will surface as CCTS trading matures and as green procurement expands.
Second, lower-carbon products such as LC3 and high-performance blended cements are creating differentiated market segments. Customers in infrastructure, real estate and export-oriented construction are beginning to specify embodied-carbon limits.
Third, investors and lenders increasingly treat carbon intensity as a financial risk factor. Traditional KPIs can mask the divergence between short-term cash profit and long-term carbon-adjusted value.

What is carbon-adjusted profitability?
Carbon-adjusted profitability evaluates normal profit after explicit adjustment for carbon performance. A practical expression is:
Carbon-Adjusted EBITDA = Conventional EBITDA – Carbon Cost + Green Premium Income
Carbon cost may be an internal carbon price, the actual cost of purchasing Carbon Credit Certificates under CCTS, or the opportunity cost of high emissions relative to peers. Green premium income arises when customers pay more for verified lower-carbon cement or when the company sells surplus credits. Tracking both conventional and carbon-adjusted profit side-by-side gives management a clearer picture of value creation under evolving market rules.

Table 1. Traditional KPIs versus Carbon-Adjusted Leadership Metrics
Traditional Focus New Leadership Metric Why It Matters
Specific energy consumption Emissions intensity (kg CO2/t cement) Directly linked to future CCTS and CBAM costs
Kiln utilisation Carbon-adjusted contribution margin Reveals true value of incremental volume
Clinker factor Share of lower-carbon products sold (incl. LC3) Measures commercial success of the transition
Power cost per tonne Effective carbon cost per tonne sold Expose hidden liabilities
Absolute EBITDA Carbon-adjusted EBITDA + green premium Aligning profit with future market reality

LC3: Technical foundations and performance advantages
LC3 is a ternary blended cement that typically combines approximately 50 per cent clinker, 30 per cent calcined clay, 15 per cent limestone and 5 per cent gypsum (the classic LC3-50 formulation). The decisive technical advantage is that clay is calcined at 700–850 °C, far below the 1,450 °C required for clinker production. This lower temperature, together with the substantial reduction in clinker content, delivers CO2 reductions of 30–40 per cent relative to ordinary Portland cement (OPC).
Chemistry is synergistic. Calcined kaolinitic clay (metakaolin) reacts with calcium hydroxide from clinker hydration and with limestone to form additional C-A-S-H gel and carboaluminate phases. These phases densify the microstructure, reduce porosity and improve durability.
Field experience shows superior resistance to chloride ingress, sulphate attack and alkali–silica reaction. Early-age strength can match OPC with high-reactivity clays; later-age strengths routinely meet 42.5 and 52.5 grade requirements.
Importantly, LC3 does not require high-purity kaolin. Clays with 40 per cent or even lower kaolinite content can be activated successfully, expanding raw-material availability across India. Calcination can use adapted rotary kilns or dedicated flash calciners, making the technology compatible with existing plant infrastructure and far less capital-intensive than carbon capture.
Economic analyses show that LC3 can be produced at equal or lower cost than OPC in many locations because of reduced energy demand and cheaper clay. Life-cycle assessments consistently report 30–40 per cent lower embodied CO2 per tonne of cement.
Table 2. Comparative profile: OPC versus LC3-50
Parameter OPC LC3-50
Typical clinker content ~95 per cent ~50 per cent
CO2 emissions (relative) Baseline (≈0.85 t CO2/t cement process + fuel) 30–40 per cent lower
Clay calcination temperature Not applicable 700–850 °C
Key hydration products C-S-H, portlandite, ettringite C-A-S-H + carboaluminates
Chloride & sulphate resistance Good Superior
Production cost potential Baseline Equal or lower in most locations
Infrastructure compatibility Existing High (minor adaptations)

In India, commercial adoption has begun in earnest. JK Cement commenced the first commercial production of LC3 in the Indian subcontinent at its Mangrol plant in Rajasthan in 2025 under BIS standard IS 18189.
By early 2026, approximately 2,000 tonnes had been produced and sold, avoiding an estimated 500 tonnes of CO2. JK Lakshmi Cement followed with commercial launch of its Green PRO LC3 grade from the Jaykaypuram plant. As of mid-2026, two producers are supplying LC3 to the market. The first large-scale infrastructure application is the Noida International Airport (Jewar), where LC3 was used in the runway and a building complex, demonstrating full constructability and performance under demanding conditions. These early volumes are still small relative to national cement demand, but they mark the critical transition from pilot to commercial reality. Companies that scale capacity now will be positioned to capture both CCTS credits and emerging green-procurement demand.

Why the shift is accelerating
According to the World Bank’s State and Trends of Carbon Pricing 2026, direct carbon pricing now covers nearly 30 per cent of global greenhouse-gas emissions and generated more than US$107 billion in public revenue in 2025. The average global carbon price stands at approximately US$21 per tonne, although regional prices vary widely.
In Europe, the EU ETS price has traded near €80–85 per tonen in mid-2026. Free allocation for cement is being withdrawn in parallel with CBAM. European producers therefore face a clear signal: every tonne of avoided CO2 improves both compliance and competitiveness. Holcim has scaled calcined-clay production, including Europe’s first dedicated line at Saint-Pierre-la-Cour (France) and a second line in the Czech Republic (2026). Heidelberg Materials, Cementir (FUTURECEM) and others have commercialised low-clinker calcined-clay blends across multiple markets, showing that carbon-adjusted profitability is already reshaping capital allocation in the world’s most mature carbon market.India’s CCTS is now operational. Binding emission intensity targets apply to 186 cement facilities for FY 2025–26 and FY 2026–27. Average required reductions for integrated plants are modest (around 2.7 per cent by FY 2027), yet the direction is clear.
Trading of Carbon Credit Certificates is expected in the second half of 2026, with early prices likely in the `800–1,500 per tonne range. Plants that outperform targets can sell credits; those that underperform must buy them or face compensation. Cement is well positioned to be a net supplier of credits if clinker factor continues to fall through LC3 and other low-clinker systems.

Way forward for India
India starts from a strong baseline, world-class energy efficiency and a clinker factor already lower than the global average. The next competitive frontier is the deliberate reduction of process emissions through clinker substitution at scale. LC3 is uniquely suited to Indian conditions because suitable clays are widely distributed, the technology fits existing kiln and grinding infrastructure, and the resulting product can meet the performance demands of both infrastructure and building construction.
A practical national pathway contains five interlocking elements:

  1. Standards and acceptance: Accelerated finalisation and promotion of BIS specifications for calcined-clay and limestone–calcined-clay cements will remove a key barrier to commercial uptake. Alignment with European practice (EN 197-5) can facilitate knowledge transfer and export readiness.
  2. Supply-chain development: Investment in flash calcination capacity and systematic characterisation of regional clay deposits will secure reliable, low-cost feedstock. Existing rotary kilns can be adapted for initial volumes while dedicated calciners are built.
  3. Incentive alignment: Part of variable compensation for plant managers, sales teams and senior leadership should be linked to emissions intensity reduction and to the volume of lower-carbon products (including LC3) sold. Without this link, traditional volume and cost targets will continue to dominate behaviour.
  4. Product-level carbon accounting: Reliable measurement of emissions intensity at the individual cement grade level, supported by third-party verification where required, is essential for both CCTS compliance and credible green claims.
  5. Demand-side pull: Green public procurement policies that specify maximum embodied-carbon thresholds for major infrastructure projects will create a predictable market for LC3 and other low-carbon cements, accelerating scale and cost reduction.
    Companies that treat LC3 as a strategic product line rather than a niche offering will be better positioned to generate surplus Carbon Credit Certificates, capture any emerging green premium, and protect margins as carbon costs rise.

Organisational changes required
Technical capability alone is insufficient. Three organisational shifts are required.
Daily management: Emissions intensity must appear on the same daily and monthly dashboards as heat consumption, power consumption and utilization. Plant reviews should examine both conventional and carbon-adjusted results.
Incentives: A meaningful portion of bonuses for plant heads, technical teams and sales leadership should be tied to lower emissions intensity and successful commercialisation of LC3 and other low-carbon grades.
Commercial approach: Sales teams need clear volume and pricing targets for lower-carbon products, supported by technical service that helps customers specify and place the material correctly. Without commercial pull, excellent technical performance remains under-utilised.

Table 3. Three-stage roadmap to carbon-adjusted profitability
Time Horizon Priority Actions Expected Outcome
Next 12 months Add emissions intensity to plant dashboards; establish internal carbon price; initiate LC3 pilot production and customer trials Visibility and early organisational learning
12–24 months Revise incentive systems; scale LC3 and other low-carbon grades to key accounts; secure third-party verification capability People and sales aligned with carbon goals
24–36 months Embed carbon-adjusted metrics in board reporting and capital allocation; expand calcined-clay capacity Full system integration and competitive advantage

Questions senior leaders should ask
Boards can accelerate the transition by insisting on answers to a short list of questions:
• Is our carbon-adjusted profit improving, stable or declining relative to conventional EBITDA?
• Did recent volume growth improve or worsen our emissions intensity?
• What share of sales already comes from lower-carbon products, including LC3, and what is the trajectory?
• How exposed is our capital expenditure plan to rising carbon costs under CCTS and potential CBAM-related requirements?
• Do our incentive systems still reward only volume and cost, or have they been updated to include carbon performance?
Treating carbon with the same seriousness as energy cost or kiln utilization does not diminish operational excellence; it expands the definition of excellence to match the new competitive reality.

Looking ahead
By 2030 the gap between leading and lagging cement companies will not be decided by who records the lowest specific heat consumption. It will be decided by who delivers the strongest carbon-adjusted profits.
Absolute emissions may still rise as national production grows. That is not the issue. Companies that reduce intensity year after year and successfully sell cleaner products will pull ahead in both domestic and export markets. Those that do not will fall behind, even if their traditional efficiency numbers look strong.
Operational excellence built the Indian cement industry. It remains the foundation. It is no longer the complete picture. Carbon-adjusted profitability is the clearer measure of success.
LC3 is not a distant technology. It is available now. It cuts CO3 by 30–40 per cent, works with existing plants, and is already in commercial production in India. Companies that treat it as a strategic product, not a pilot, will protect their margins and generate tradable credits.
Leaders who act now will place carbon metrics on daily dashboards, link incentives to intensity reduction and LC3 sales, invest in calcined-clay capacity, and build commercial capability to sell lower-carbon products. They will shape the next chapter of the industry.

References

  1. World Bank. (2026). State and Trends of Carbon Pricing 2026. Washington, DC: World Bank Group.
  2. International Carbon Action Partnership (ICAP). (2026). India Carbon Credit Trading Scheme – Status and Coverage. Berlin: ICAP.
  3. Ministry of Environment, Forest and Climate Change / Bureau of Energy Efficiency. (2025). Greenhouse Gases Emission Intensity Target Rules, 2025. New Delhi: Government of India.
  4. Scrivener, K., Martirena, F., Bishnoi, S., & Maity, S. (2018). Calcined clay limestone cements (LC3). Cement and Concrete Research, 114, 49–56.
  5. RMI. (2024). The Business Case for LC3. Rocky Mountain Institute.
  6. European Commission. (2026). EU Emissions Trading System – Allowance Price Data and Free Allocation Phase-out Schedule. Brussels.
  7. Holcim. (2025–2026). Scaling Calcined Clay for Sustainable Building – Corporate Updates on European and Latin American Capacity. Zurich: Holcim Ltd.
  8. LC3 Project / EPFL. (2026). LC3 – A Guide to Best Practices for Scalable, Affordable and Sustainable Low-Carbon Building. Lausanne: École Polytechnique Fédérale de Lausanne.
  9. Business Today / Industry Reports. (2026). First Large-Scale LC3 Application at Noida International Airport, Jewar. New Delhi.
  10. NITI Aayog / Industry Analyses. (2026). Roadmap and Baseline Performance Indicators for the Indian Cement Sector. New Delhi.
  11. Springer / Innovative Infrastructure Solutions. (2026). LC3 Systems: A Review of Chemistry, Performance, Durability and Sustainability toward Market Adoption.
  12. Cementir Holding / Industry Sources. (2025–2026). FUTURECEM and Related Low-Clinker Technologies in Europe.
  13. Climate Risk Horizons & Independent Analyses. (2026). Assessment of Emission Intensity Targets under India’s CCTS for Cement and Other Hard-to-Abate Sectors.
  14. GCCA / TERI. (Various years). Decarbonization Roadmaps for the Indian Cement Industry.
  15. EN 197-5:2021. Cement – Part 5: Portland-composite cement CEM II/C-M and Composite cement CEM VI. European Committee for Standardization.

Continue Reading

Video Thumbnail
▶

    SIGN-UP FOR OUR GENERAL NEWSLETTER

    Trending News

    SUBSCRIBE TO THE NEWSLETTER


    Don't miss out on valuable insights and opportunities to connect with like minded professionals.


      This will close in 0 seconds