

Concrete
Concrete as a Carbon Sink for Reducing Global Warming


Dr Anjan K Chatterjee, Managing Director, Conmat Technologies, Kolkata, presents a comprehensive analysis of the intricate dynamics of the carbon cycle and its implications for global climate change, particularly focusing on the role of the cement and concrete industry. Examining the interplay between carbon sources and sinks, he explores the potential of concrete as a carbon sink, shedding light on its carbonation process and the implications for CO2 sequestration, in the first instalment of this two-part series.
The ‘Carbon Cycle’ that interconnects the natural carbon sources and carbon sinks is a critical life-support process in our planet (Figure 1). The most abundant greenhouse gas, carbon dioxide (CO2), is continuously recycled on the earth. Carbon sources refer to the processes that release CO2 to the atmosphere, while carbon sinks are the processes that absorb it. As we know, forests, soil, oceans, the atmosphere, and fossil fuels are the important stores of carbon and it moves between these different stores that act either as sinks or sources. It is also understood that a sink absorbs more carbon than it gives off, while a source emits more carbon than it absorbs. The amount of carbon in the atmosphere at any time depends on the balance that exists between the sinks and sources.

Figure 1: Carbon sources and sinks constituting the carbon cycles
Before the Industrial Revolution the carbon cycle was relatively balanced but it has been tilted later towards higher concentration of carbon in the atmosphere due to the increasing industrial activities on the planet (Figure 2). This has been happening because humans produce the greenhouse gases (GHG), and more particularly CO2 and CH4 (methane), much faster than the natural sources can absorb them. The production-based global generation of GHG, and the top eight GHG emitting countries in 2018 are shown below:
- China: 11,706 MT CO2-e
- USA: 5,794
- India: 3,347
- EU + UK: 3,333
- Russia: 1,992
- Indonesia: 1,704
- Brazil: 1,421
- Japan: 1,155
- Total World: 48,928
Among the industrial activities, the production of Portland cement ranks high in generating CO2, creating up to 8 per cent of worldwide man-made emissions of this gas. This is identified as a major contributor to the probable rise in average global temperature exceeding 20C. In recent years, a school of thought has emerged whether it is justified to consider the amount of CO2 emitted directly from the cement manufacturing process as the total cement industry emissions to affect the global temperature rise. This is due to the fact that cement is used mainly in the form of concrete, mortar and plaster in built structures, which over time undergo carbonation involving reverse penetration of CO2. The knowledge about carbonation of existing concrete structures is well-established. The CO2 uptake by the cement-based products including concrete has not been considered historically in the CO2 estimation for climate change. Furthermore, there are many technologies in development, which promise significant potential of enhancing the recycling of CO2 in concrete and cement-based products. Thus, it seems justified to consider that, while the cement production is a carbon source, the cement-based products may act as carbon sinks. The concept of concrete as a carbon sink will be a game-changer for the cement and concrete industry as a whole for improving the climate performance of the sector.
Recap of Concrete Carbonation
Carbonation of concrete has been a subject of study primarily for understanding the mechanism of reinforcement corrosion and the resultant deterioration of concrete. In concrete carbonation, the reaction process relates to the cement matrix part of the concrete and its occurrence is eventually inevitable. It is caused by the ingress of atmospheric CO2 reacting with the pore water to form carbonic acid, which in turn reacts with the lime-bearing hydrated phases in the cement matrix.. This neutralises the alkalinity of concrete and occurs progressively. A carbonation front moves through the concrete until it reaches the steel. The passive layer then breaks down as pH falls from over 12.0 to around 8.0. In fact, corrosion of steel starts in the presence of O2 and H2O as pH falls below 11.0.

A typical Portland cement concrete may show a carbonation depth of 5-8 mm after about 10 years, rising to 10-15 mm after 50 years. Therefore, structures with low concrete cover over the reinforcing steel will show carbonation-induced corrosion more quickly than those with good cover. The rate of advancement of the carbonation front is dependent on the diffusion kinetics of CO2 in concrete, which in turn is related to its quality. Concretes made with high w/c ratios and with low cementitious materials content will carbonate faster than low-porosity high-strength concrete. The blended cement concretes, because of their low alkaline reserves, tend to carbonate faster than the grade of concrete for an equivalent OPC content. The rate of carbonation is also affected by the environmental conditions. Carbonation is more rapid in fairly dry and wet-and-dry cyclic environments.
Though carbonation is a harmful process for the reinforcement steel, for the concrete mass without metal reinforcement, the effect is beneficial, because the product of carbonation reaction CaCO3 has larger volume than the major hydrating phase Ca(OH)2, thus resulting in better pore filling and increase in the strength of concrete. It has also been observed that the carbonation reactions occur during the entire life cycle of a structure or a concrete element, though it might be initiated at the exposed surfaces and limited to cover concrete, jointing mortar and plasters and renderings. Interestingly, a study on concrete bridges cast between 11 and 76 years revealed that at 76 years of casting carbonation of concrete was still evident except that the carbonation rate was lower compared to newer structures [1].
Carbonation reaction
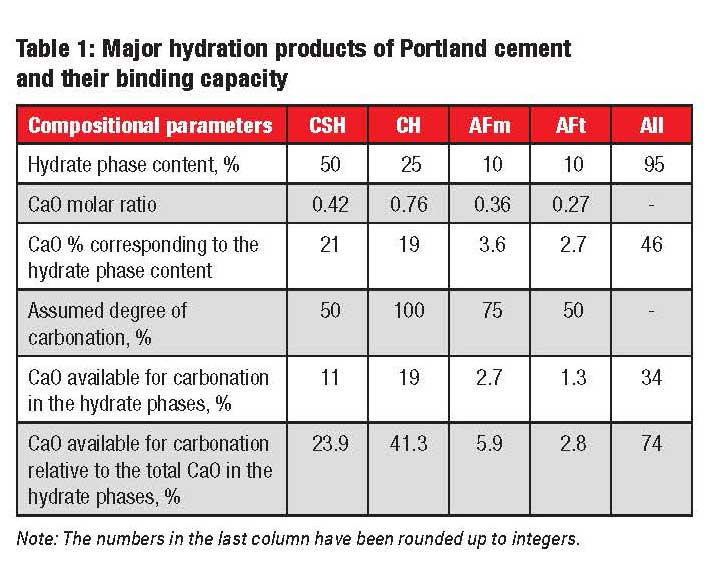
It is known that surfaces of concrete and other cement-based materials in direct contact with carbon dioxide and water are prone to carbonation, which spreads inwards at a rate proportional to the square root of time. The hydrated cement phases and the pore solution are the starting points for carbonation. There are four important hydration products with varying amounts of CaO available in them for carbonation as shown in Table 1 [2]. Portlandite (CH) and C-S-H gel are the most abundant in occurrence with high binding capacity.
Carbon dioxide dissolves in the pore solution of cement paste, producing carbonate ions, which react with calcium ions to produce solid calcium carbonate. The hydroxyl and calcium ions required by these reactions are obtained by the dissolution of calcium hydroxide and decomposition of the hydrated silicate and aluminate phases. The reactions involving the calcium hydroxide and calcium silicate hydrate phases may be represented by the following equations:
CO2 + 2OH- ? CO32- + H2O
(1)
Ca2+ + CO32- ? CaCO3 (2)
Ca(OH)2 ? Ca2+ + 2OH- (3)
xCaO.SiO2(aq) + zH2O ? yCa2+ + 2yOH- + (x – y)CaO.SiO2(aq)
(4)
The rate and degree of carbonation is governed mainly by the factors such as the size and geometry of the porous structure, the degree of water saturation in the pore system, the type of cement and supplementary cementitious materials, the chemical composition of the pore solution, the temperature, and the concentration of CO2 in the atmosphere. As already stated above, the carbonation of the hydrated cement matrix results in increase of strength and hardness in concrete and also reduction of its permeability and shrinkage. The concrete becomes more volume stable and consequently, further volume destabilisation due to subsequent moisture changes is prevented.
co2 Uptake in Concrete
The degree of carbonation in concrete is generally determined in the laboratory by the phenolphthalein test. The phenolphthalein applied carbonated periphery in a broken piece of a carbonated concrete is shown in Figure 4.

Figure 4: Carbonated periphery of a crushed concrete fragment as determined by the phenolphthalein test.
It is generally observed that in the first year of service the carbonation depth varies from I mm in dense dry concrete to 5 mm or more in more permeable concrete with high water content. The depth increases in subsequent years. The carbonation process proceeds faster when RH lies in the range of 50-75 per cent.
Calculating the uptake of CO2 in concrete and other cement-containing products as well as its impact on the global climate is a complex task. There is no unambiguous calculation method that can be used for this purpose. However, certain approximate and empirical models were attempted for this purpose and the results were significantly different. A comprehensive summary was published in 2016 [3]. The findings can be broadly summarised as follows:
- A study conducted in 2005 in four Nordic studies showed that within 50 years the projected extent of carbonation will range from 24% to 43%. The penetration depth will be about 32 mm.
- A 1997 study of 18 bridges, aged from 14 to 56 years at the time of study, reported carbonation depths of up to 50 mm.
- A 2017 study of the Itaipu dam commissioned in 1984 in Paraguay reported the average and maximum carbonation depths of 33 mm and 73.3 mm.
- A 2018 study of two 100-year old bridges in Slovakia revealed that the exposed surfaces carbonated to a depth of 60 mm, but some surfaces protected by 2-3 mm layers of impermeable plaster prevented carbonation.
- The demolished concrete materials showed faster rates of carbonation.
Another study, based on different datasets compiled from field surveys in China and a comprehensive synthesis of prior data, was reported in [4]. The study attempted to model the global atmospheric CO2 uptake not only in concrete but also in mortar, construction cement waste, and cement kiln dust between 1930 and 2013 in four regions, e.g., China, the US, Europe and the rest of the world. Furthermore, the study included a sensitivity analysis of the uptake estimates in respect of 26 different variables. Without going into the details of calculations, it may be stated that for concrete three stages in the lifecycle were considered – service life, demolition and secondary use of concrete waste. In each case the exposed surface areas, thicknesses, exposure conditions including the atmospheric CO2 concentrations in different regions, and exposure time were taken into account in the modelling exercise. The average service life of the buildings was derived from the range of 35 to 70 years. The effects of different strength classes in concrete, exposure conditions, additions and coatings were explicitly modelled. The calculation of carbon sequestration from mortar was calculated from mortar thickness and annual carbonation depth. The carbon uptake in construction waste and kiln dust was calculated with due consideration of the generation rate and measured carbonation fractions. For modelling, Fick’s diffusion law was used and the carbonation rate coefficients were derived from both experimental measurements and review of relevant literature. The net annual CO2 emissions related to cement production minus the estimated annual CO2 sequestration due to carbonation of cement materials is shown in Figure 5. Between 1990 and 2013 the annual carbon uptake has shown an increase 5.8 per cent per year on average, slightly faster than 5.4 per cent growth in process emissions. Cumulatively it was estimated that an amount of 4.5 GtCyr-1 has been sequestered by cement materials since 1930 and more specifically, the annual sequestration rate increased from 0.10GtCyr-1 in 1998 to 0.25 GtCyr-1 in 2013. In total, it was estimated that roughly 43 per cent of the cumulative cement process emissions of CO2 produced between 1930 and 2013 have been reabsorbed by carbonating cement materials.
A few other points that emerged from this study are worth mentioning:
- During the period of study, based on the regional details, the break-up of CO2 storage was 68 per cent from concrete, 27 per cent from mortar, 2 per cent from cement losses in the course of construction, and 3 per cent from cement kiln dust
- Cement mortars acted as the most effective carbon sink, though only 30 per cent of cement is used in it. This was apparently because of the extensive exposed exterior surface of mortars.
- Despite a relatively smaller exposure area, concrete was the second largest contributor to the carbon sink, because of its sheer volume.
- The cement losses during construction and the cement kiln dust at the production stage were also contributors to the total sink.
Reporting co2 Emissions
Three international systems for monitoring, quantifying and reporting of CO2 emissions are prevalent:
- Reporting of national CO2 emissions to UNFCCC (United Nations Framework Convention on Climate Change)
- EU climate and energy frameworks for lowering climate impact
- Environmental product declaration (EPD)
The guidelines for UNFCCC reporting were developed by the IPCC (Intergovernmental Panel on Climate Change). Although the carbonation of cement products was included in the document in 2006 but the scientific consensus then was not in favour of inclusion into national inventories. Since it has now emerged from various studies that the concrete as carbon sink must be accounted for in calculating the net emissions of CO2, there is an urgent need to review the IPCC guidelines. The situation is not much different in the EU systems that include ETS (Emission Trading System) and ESR (Effort Sharing Regulation). It appears that there is some flexibility in EU/ESR to consider CO2 bound in construction timber but not for the emissions and uptake by the concrete construction. In EPD, there is a scope for following the European standard EN 16757:2017 (Sustainability of construction works – Environmental Product Declarations – Product Category Rules for Concrete and Concrete Elements), though mortars and renderings are not covered in the standard.
Thus, there is a visible gap in developing a scientifically reliable approach for tracking and reporting of CO2 emissions and absorption in the cement, cement-based building products and concrete construction sectors at the national and international levels.
Modeling approach for calculating CO2 uptake in existing concrete structures
A comprehensive review has been presented in [5]. The emission and uptake model, illustrated by the author, is reproduced in Figure 6. Compared to the emission process, the uptake processes are much slower and longer. The primary uptake is by concrete structures such as bridges, house frames, concrete tiles, concrete roads, railway sleepers, cement mortars, etc. The uptake by the post-demolition secondary products refers to crushed concrete, which may be used in as a road base or for landfilling. A complete CO2 uptake model must consider both the primary and secondary uptakes with different timeframes.
The depth of carbonation, d, can be calculated by the well-established formula: d=kvt, where, t is time and k is the rate of carbonation, depending on the exposure and concrete quality. In addition, it is necessary to know another parameter, DOC (Degree of Carbonation), defined as the amount of CO2 uptake in relation to the theoretical maximum CO2 uptake, corresponding to 100 per cent DOC. While the theoretical maximum uptake can be taken as the amount of CO2 emitted from the limestone calcination in the clinker making process, the degree of carbonation may be determined by the phenolphthalein test on concrete samples. Values of k and DOC are provided in the annexure to EN 16757:2018.
The CO2 uptake in kg per m2 of concrete during t years for any application can be calculated as CO2 uptake at a surface = (k x DOC)(v (t)/1000) x Utcc x C, (5)
Where k is the rate of carbonation for the surface in mm/v(t),
DOC is degree of carbonation for the surface,
T is the number of years, Utcc is the maximum theoretical uptake in kg CO2/kg cement (e.g., ~0.49 for CEM I), C is the cement content in kg cement/m3 concrete.
For an application, structure or product the total CO2 uptake in kg may then be calculated, based on the sum of the uptake at all different surfaces according to the equation
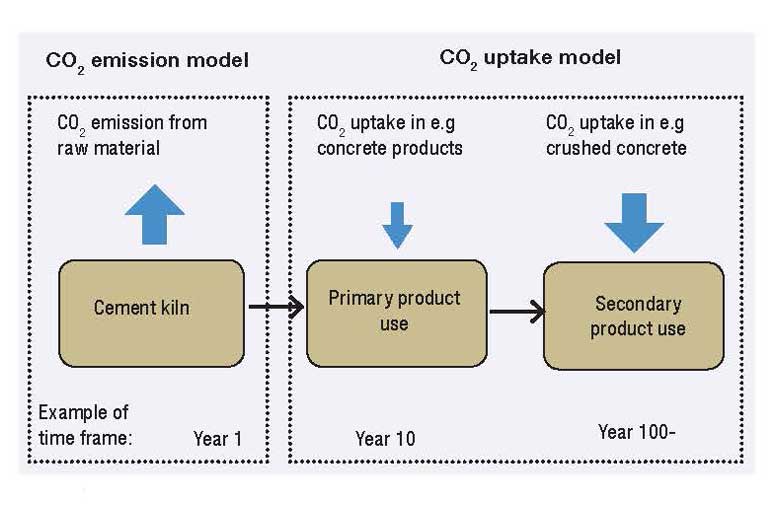
Figure 6: Schematic diagram of the CO2 emission and uptake model.
Total CO2 uptake = S(ki x DOCi x Ai) x Utcc x C (6) where i denotes surfaces and A is the surface area in m2.
Further, the CO2 uptake per m3 can be obtained by dividing the total uptake by the total volume of concrete.
The blended cements or concrete with additions like granulated slag, fly ash or calcined clay are normally considered to have higher carbonation rates but precise and reliable data is not readily available. Hence, a possible way out for the present may be to apply a factor, corresponding to the clinker content in the blended cement, to the theoretical uptake computed for the normal Portland cement such as CEM I.
Further to the above approach of modeling, two other progressively more precise approaches, termed as tier 2 and tier 3, have been proposed in [5], These refined approaches essentially are based on the use of historical cement production and application statistics in a country or a region with varying timeframes. The three tiers will also differ in respect of the uptake parameters at the end-of-life stage and the secondary use stage of concrete. The intent is to have a reliable estimate of net emissions of CO2 from the cement industry after proper accounting of reabsorption of CO2 in concrete and other cement-based building products.
*References will be provided in the concluding part, in the next issue
ABOUT THE AUTHOR
Dr Anjan K Chatterjee is a Fellow at the Indian National Academy of Engineering, a Materials Scientist and the Author of ‘Cement Production Technology: Principles and Practice.’
Table 1: Major hydration products of Portland cement and their binding capacity
Compositional parameters CSH CH AFm AFt All
Hydrate phase content, % 50 25 10 10 95
CaO molar ratio 0.42 0.76 0.36 0.27 –
CaO % corresponding to the hydrate phase content 21 19 3.6 2.7 46
Assumed degree of carbonation, % 50 100 75 50 –
CaO available for carbonation in the hydrate phases, % 11 19 2.7 1.3 34
CaO available for carbonation relative to the total CaO in the hydrate phases, % 23.9 41.3 5.9 2.8 74













JSW Cement Commissions 1 MTPA Unit in Rajasthan

Wonder Cement appoints Mahesh Singh as VP Corporate Brand Communication

JSW Cement commissions additional 1 MTPA grinding unit in Rajasthan

JSW Cement Boards Approve Proposed Shiva Cement Merger

JSW Cement commissions additional 1 MTPA grinding unit at Nagaur
JSW Cement Commissions 1 MTPA Unit in Rajasthan
Wonder Cement appoints Mahesh Singh as VP Corporate Brand Communication
JSW Cement commissions additional 1 MTPA grinding unit in Rajasthan
JSW Cement Boards Approve Proposed Shiva Cement Merger
JSW Cement commissions additional 1 MTPA grinding unit at Nagaur
-

 Concrete1 month ago
Aditya Birla Group Launches Ultravolt Wires And Cables Business
-

 Concrete4 weeks ago
Cement Demand Strong As Prices Remain Stable
-

 Concrete1 month ago
Ramco Cements Mine Restoration Gets Global Biodiversity Certification
-
 Concrete3 weeks ago
Telangana to Supply Subsidised Cement for Indiramma Houses