Concrete
Recycling will increase the life of oils and grease.”
Published
3 years agoon
By
admin
Mukesh Saxena, Joint President, Star Cement, discusses the different kinds of lubricants used in the cement industry and the sustainable methods of using them.
How are the different types of lubricants corelated to their specific applications at a cement plant?
The term ‘lubricant’ describes a substance used to reduce friction between moving parts in a machine. Applied to individual components and complete engine systems, the main goal of lubricants is to minimise friction during movement. This helps to prevent wear and tear on moving parts and reduce the risk of mechanical failure due
to overheating.
The types of lubricants used in the cement industry include:
Oil lubricants: Thin and highly viscous, oil-based lubricants are made up of long polymer chains enhanced with additives. These can include corrosion inhibitors to prevent rust, antioxidants to prevent oxidisation and detergents to prevent the formation of deposits.
The viscous characteristics of oil-based lubricants make them useful for applications where even the smallest increases in resistance can affect performance. As oil is easy to disperse, these types of lubricants are also useful for applications where it’s not possible to disassemble the entire machine. In these scenarios, oil can be fed into the machine, where it will quickly disperse to all moving parts.
Lubricating Oils SP220, SP320, SP420: Used in gearboxes depending on temperature generations. High viscosity oil is used whereas temperature is high, for normal temperatures SP320 is used, whereas for low temperatures and low ambient temperatures SP220 is used.
Required in VRM gearboxes, kiln main gearboxes, conveyor gearboxes etc. Hydraulic oils used for hydraulic systems are operative and accordingly based on pressure required, for vertical mills hydraulic systems, kiln thruster etc.
Grease lubricants: Generally manufactured by combining an oil (usually mineral based) with thickeners (often a lithium, calcium, or sodium-based soap), greases blend well with existing lubricants in the oil, helping them accumulate on the surface and add an extra layer of lubricity. This type of product is often used to lubricate gears, bearings, linkages and chains.
Grease is also an excellent barrier, helping to protect surfaces from water droplets and dust as well as build ups of debris and contaminants. The viscous consistency of grease gives it good longevity and ongoing performance, winning it points when it comes to minimising maintenance.
- Uses of Grease
- For normal solid lubricants EP2 used
- For high temperatures graphite-based greases are used
Special Synthetic lubricants: High pressure synthetic lubricants are used in specific high temperatures and systems like high pressure hydraulic systems, kiln girth gear etc.
Penetrating lubricants: Unlike oils and grease, penetrating lubricants aren’t designed for long-term performance. This type of lubricant has ultra-low viscosity and is designed to infiltrate small fractures in the surface. The goal is to increase lubrication and break up any rust or debris that may have formed. Penetrating lubricants are often used to loosen seized screws and bolts.
Dry lubricants: Step up when oils and grease are unsuitable. They are capable of withstanding higher temperatures and don’t undergo the same state changes when the mercury rises. Dry lubricants also perform well in the face of excessive wear, migration, and exposure to debris. Rather than degrade in tough conditions, they remain intact and offer ongoing lubrication. This makes them ideal for use with heavy-duty infrastructure.
Dry lubricants are generally available as fluorocarbons (such as PTFE) or crystalline lattice structures (including graphite, tungsten disulphide and molybdenum). Impressive anti-friction, bond strength and chemical resistance capabilities make dry lubricants the product of choice for a wide range of applications in the oil and gas industry.
How do you ensure the quality of the lubricants used in your facility? What certification processes do you use?
A variety of methods are used to test for the quality of lubricants, including globally used standards published by ASTM International. Some of the methods used for lubricant quality testing are:
ASTM D445 for viscometrics: This ASTM test method is designed to determine the kinematic viscosity of both opaque and transparent lubricants. It uses a calibrated glass capillary viscometer to measure the rate at which the lubricant flows
under gravity.
ASTM D5182 for abrasive wear and friction control: This method assesses gear-tooth face wear to determine the scuffing resistance of lubricants. ASTM has strict guidelines, with rigs operated at 1450 rpm and teeth inspected at 15-minute intervals. As well as visible condition, the net weight loss of gear teeth is calculated to assess abrasive wear.
ASTM D943 for oxidation resistance: ASTM D943 is considered the gold-standard method for measuring the oxidation stability of lubricants. It is particularly useful for lubricants that are at risk of water contamination.
ASTM D1401 for water separation: This calculates the water separation characteristics of lubricants exposed to turbulence and H2O contamination.
ASTM D2896 for base number: Acidic titration is used to identify and quantify basic constituents (also known as additives) in lubricants. The ASTM D2896 method calculates the base number of each additive, with the test used to monitor quality assurance in new products and measure degradation in existing lubricants.
ASTM D2711 for demulsibility: Exposure to turbulence caused by circulation and pumping can fast-track water contamination and produce water-in-oil emulsions. The ASTM D2711 test measures the demulsibility characteristics of a lubricant and helps determine suitability for different applications.
ASTM D4951-09 for detergency: In some lubricants, additives can combine to act as detergents that actively prevents the build-up of deposits on solid surfaces.
ASTM D665 for corrosion resistance: Exposure to water and condensation can accelerate corrosion, making lubricants with anti-corrosion properties desirable for applications such as steam turbine gears. The ASTM D665 is used to evaluate the corrosion resistance of a lubricant and can also be used to test for degradation in circulating oils.
ASTM D97 for pour point: Pour point is another characteristic that can affect performance, with the ASTM D97 used to determine the lowest temperature at which flow is compromised and a lubricant becomes semi-solid.
What are the external environmental factors affecting the performance of the lubricants? How do they affect the lubricants?
- Oxidation: The chemical combination of oil or grease with oxygen. Oxidation is the most limiting factor to a lubricant’s useful life. Oil possibly may gel and become unpumpable, and eventually cause severe wear and seizure. Varnish and sludge (polymerised products) increase oil viscosity, decrease viscosity index, reduce heat transfer abilities, block oil ways, and promote foaming and emulsification. Severely oxidised oils tend to become very viscous at low temperatures. Volatile and non-volatile acids attack white-metal bearings, can be water-soluble and are more aggressive when the lubricant is wet. Sludge, varnish, emulsification, poor air release.
- Thermal degradation: Cracking at high temperatures, in the absence of oxygen. Safety hazard due to lowered flash points of the oil. Rapidly forming deposits on metal surfaces are not able to function as lubricants. Thermally degraded oils form carbonaceous residues and volatile gases. Heat built-up.
- Contamination: Most common contaminants of oils or greases are: water, fluid-soluble materials, fluid-insoluble materials erroneous fluid additives and fluid degradation. First, contamination is the most common cause of oil failure or rejection. It affects aeration, foaming, air release and demulsibility. Aeration can cause reduced compressibility of hydraulic fluids: reduced volumetric efficiency of hydraulic system pumps; loss of power transmission efficiency; cavitation damage in pump suctions and servo-valves; inadequate response times for turbine over-speed systems; localised oil oxidation in highly loaded regions; interference to oil flow through filters.
- Foaming: The action of frothy bubbles being formed in the fluid due to excess air. Foam is not a good lubricant. Air or oil foam can accumulate in the headspace of reservoirs, gearboxes, crankcases, sumps, and other components with vapor spaces. Excessive foam may be forced out of the reservoir through the breather cap. May be ingested into the circulation pump. May interfere with the effective lubrication of gears and bearings.
- Air release: Letting air out of bubbles in the oil. This should occur quickly. Significantly affected by oil viscosity and temperature. Poor air release can contribute to oil foaming. High oil viscosity. Low oil temperature. Contamination by diesel engine oils, greases, and corrosion preventives. Presence of rust particles. Contact with very hard water.
- Demulsibility: The ability to release or shed water. Undesirable if water is not separating rapidly from the oil (especially in turbine and gear oils or hydraulic fluids). Poor oil or grease demulsibility can cause corrosion of ferrous metals, significant reduction in the fatigue life of ball bearings, roller bearings and gears; and the removal of rust inhibitors and some anti wear and lubricity additives from oils.
Tell us about recent innovations in lubricant technology that you have implemented.
Use of nanotechnology in lubricants. Nanoparticle additives show significant enhancements in lubricant attributes like anti-oxidation capability, tribological features, and thermal properties. Nanotechnology offers the possibility of using nanosised additives to increase the performance of lubricating oil. The addition of nanoparticles to conventional base oils is a promising method for improving properties like friction and wear resistance in instruments.
How do you ensure proper storage and handling of lubricants at your facility?
- Lube room design and requirements: A properly designed lube room must be functional, safe, and expandable, and provide all necessary storage and handling requirements for the facility. Lube room designs should allow the maximum storage capacity without allowing for too much bulk oil and grease storage. Limiting the amount of bulk oil and grease storage will allow the oils that are stored to be used in a timely manner.
- Bulk oil storage: The first area of a lubricant storage and handling system that requires attention is bulk storage. Whether storing lubricants in a 10,000-gallon tank or 55-gallon drums, it is very important to ensure the lubricants’ quality is not tainted by contamination or additive settling. To help ensure lubricants stay in an optimal condition, one must determine how much lubricant should be stored at one time.
- New oil receiving: Oftentimes, improper receiving techniques do nothing but promote higher risks of contamination ingression, mixing of lubricants, etc. Proper written receiving procedures should be in place to ensure the highest level of consistency and cleanliness is maintained.
- Quality control: Quality control of lubricants delivered from lube suppliers must be verified to ensure the correct product is being delivered and that the cleanliness of the delivered lubricant is up to current target particle and moisture cleanliness levels.
- Presence of mixed or contaminated lubricants: Oil analysis results and other quality assurance variables, such as damaged containers, rusted containers, and any other quality issue, should be well documented and catalogued.
- Dispensing options for stored oils: When stored oil is transferred from the bulk storage system to the top-up container, it is best to filter the dispensing oil. This can be made very easy with the use of a hard plumbed filtration system and a rack mounted storage system fitted with dedicated dispensing nozzles. If using 55-gallon drums, they can be fitted with quick connect fittings, a hand pump, an inline filter manifold breather and sight glass to achieve the same goal.
- Precision top-ups and drain and fills: Once the bulk storage system is properly set up, one should consider the method for transporting oil and filling machines. The best top-up method
- utilises a proper top-up container, one that is sealed from the environment, has a built in spout, hand pump, etc.
- Proper top-up container and grease gun storage: Storage for top-up containers, grease guns, rags, etc., is another important step to ensure contaminants are not introduced to the lubricants as a result of poor housekeeping. These tools should have their own dedicated fire-proof storage cabinets for easy access and organisation.
- Lifecycles and lubricant shelf life: For both oil and grease, one should be aware of their respective shelf life. Exceeding their OEM shelf life may render the product useless or severely hamper its performance. For this reason, it is best to use the First-In, First-Out (FIFO) method.
- Labelling and identification: Lubricant labelling is one aspect of storage and handling that is often overlooked. Labelling is just as critical as periodic filtration and without proper labelling it is very easy for lubricant cross contamination to occur. Lubricant cross contamination is a result of mixing two lubricants together and can yield a devastating result. This happens more often in the dispensing equipment rather than the bulk storage equipment.
How do you evaluate the cost-effectiveness of different lubricants, and what factors do you consider while making purchasing decisions?
The three main cost areas most organisations consider are parts, labour and downtime. Everyone budgets these items, but ultimately, they are all reactive measurements. The true cost can only be seen after the maintenance events have already occurred. However, there are ways to project or estimate how the changes made in your procedures and equipment while driving your lubrication programme toward excellence will impact overall profitability.
A machine that runs more often should be more profitable in that it is achieving its desired operational purpose and not drawing the attention of the maintenance team for additional parts or labour. Therefore, it makes sense to approach the larger cost-improvement issue from a standpoint of how to reduce equipment downtime by preventing lubrication-related failures.
It is apparent that using the right oils and greases and maintaining them inside the proper operating conditions will go a long way toward correcting or preventing most mechanical failures at your job site.
Generally breaks down the journey to lubrication excellence into six categories: lubricant selection, reception and storage, handling and application, contamination control, lubricant analysis, and environmental disposal. This article will focus on the first five categories and provide examples of how to improve in regard to overall lubrication excellence and cost-effectiveness. While environmental disposal is critical, it’s not necessarily a good place to look for cost savings.
Selecting the proper lubricant from the beginning is the most important step you can take to improve machine productivity. Your equipment’s needs will drive the selection process, but having a thorough understanding of different lubricant properties will allow you to pick the optimum solution.
Three types of base oils make up all lubricants: mineral, synthetic and vegetable. Synthetic-based oils tend to cost more upfront but have more consistent properties and are therefore more stable. Additionally, some synthetics can be used in hazardous plant conditions outside the specific considerations of the machine in question. For example, many synthetic-based oils have a higher flash point and are thus less susceptible as a fire hazard. If your plant
operates at higher temperatures (from the climate or a process), it likely will be beneficial to switch to a synthetic oil.
Similarly, most synthetics have a lower pour point and are better for machines starting up in very cold conditions. Again, synthetics often cost more initially, but by having better fluid properties and a longer useful life, they can pay for themselves in short order.
The most important property to consider when selecting a lubricant is the viscosity, and the first place to look for assistance when choosing the viscosity is the equipment manufacturer. Even if the manufacturer’s recommendation is not always the best advice, it is the best starting point to determine the base range for the machine. For instance, an oil-pumping system may be designed to operate at around 125 degrees F, but at certain times it can run as high as 155 degrees F due to certain plant conditions. The manufacturer’s guide only takes into account the normal operating temperature of 125 degrees F in its viscosity recommendation.
To ensure your lubricant remains viable, select an oil that meets both the minimum and maximum operating conditions and has a viscosity index (VI) that can withstand condition changes. If you work in a climate that is particularly hot or cold, the manufacturer’s recommended lubricant may be incorrect solely because it is assumed the machine is operating in more temperate climates.
Temperature is an important factor to consider, because lubricant life is closely tied to operating temperature. Reducing the oil’s operating temperature by 18 degrees F will double its life expectancy. This means fewer oil changes as well as less labour and downtime. If the system operating temperatures cannot be changed, a similar (but lesser) result can be achieved by making certain that the selected lubricant has the right VI additive to allow for all environmental and climate conditions.
There are many other additives and fluid properties to be considered for a specific machine application, but accounting for the viscosity and VI is the most effective means to improve lubrication. Some lubricant vendors can supply oil and grease with almost any desired package of properties. An easy way to produce cost savings at this stage is by simplifying your overall lubrication order. You may discover that you were needlessly purchasing a more expensive oil or grease. More likely, you will find that most machines can safely use the same type of oil and grease, and another area of savings can be established simply by ordering fewer lubricant types overall. Even if it costs a little more to adjust the oils and greases ordered, savings will be realised when machinery downtime decreases.
How is the role of lubricants evolving, and what steps are you taking to stay ahead of the curve?
Based on analysis, it is predicted that the value in the global lubricant market will increase by 44 per cent in the next 15 years due to more advanced formulated synthetic lubricants and with the increased demand for industrial applications. Recycling and adding more additives will increase the life of oils and greases. The cement industry has to be very cautious with the use of lubricants and to increase its uses and proper handling of used oil for recycling.
Concrete
CarbonStrong Raises Rs 125 Million To Scale Low Carbon Cement Tech
To build capacity of 100,000 tonnes a year
Published
3 days agoon
August 28, 2026By
admin
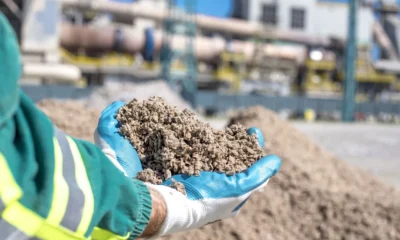
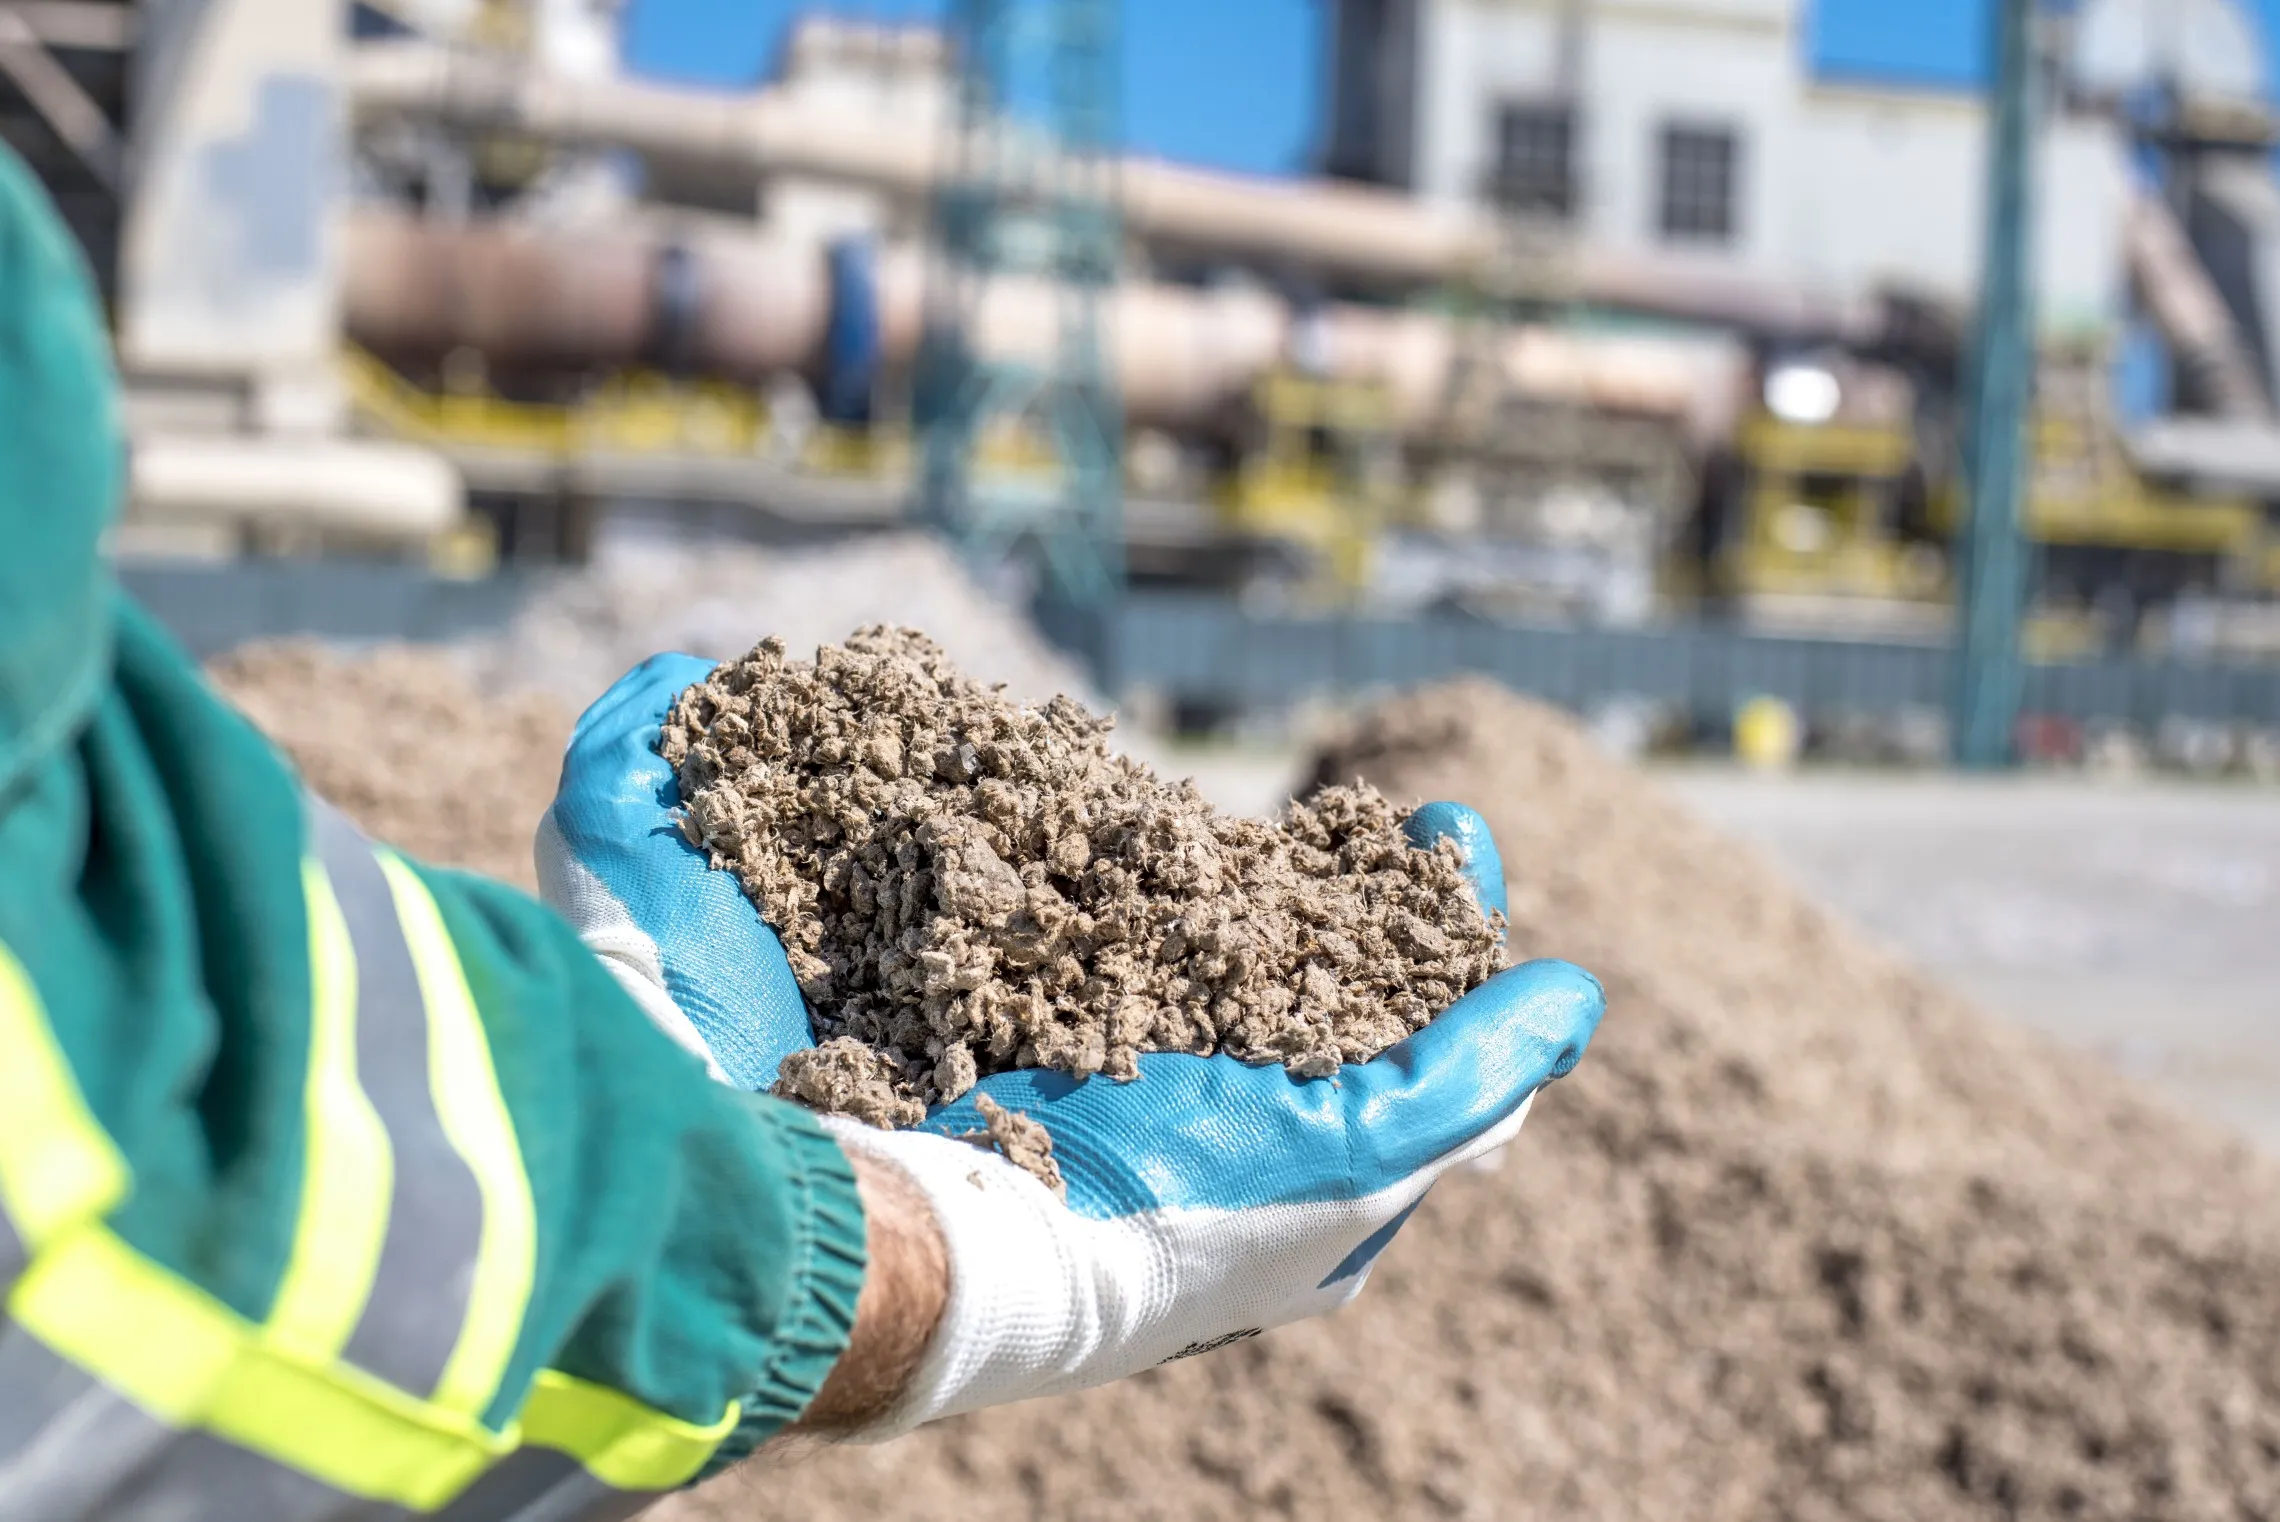
CarbonStrong has raised Rs 125 million (125 mn) to scale a low carbon cement technology and build commercial production capacity. The startup was founded in 2022 by Harsh Jain and Vikramaditya Singh and has moved from customer trials to plans for industrial supply. The company said its material replaces up to 50 per cent of cement in concrete while reducing costs and improving durability.
CarbonStrong states the product is around 30 per cent cheaper than cement and compatible with existing concrete plants, reducing the need for new equipment and operational disruption. Trials and paid pilots have been conducted in Bengaluru, Hyderabad and Chennai with demonstration projects involving ready-mix firms and precast manufacturers. Compatibility with current workflows forms a central part of the commercial strategy, aiming to ease adoption by builders and contractors.
The funding will support construction of a facility with capacity of up to 100,000 tonnes (100,000 t) a year over the next two years to supply early customers commercially. The firm is also developing materials from steel slag, copper slag and mine tailings to expand its feedstock base, while noting the technical challenge of homogenising different waste streams. Recognition by HCL ClimaForce in 2026 and by the Avaana-Startup India-NITI Aayog AIM Grand Challenge in 2025 has underscored progress.
Industry adoption remains the principal test and will require consistent material performance, supply reliability and competitive economics. CarbonStrong projects the Indian market for cement substitutes could reach Rs 250 billion (250 bn) by 2030 and has set an ambition to produce 10 million tonnes a year by 2035 (10 mn t), a target far above its near term capacity. Moving from pilots to production demands capital, manufacturing discipline and customers willing to specify the material beyond demonstrations. The recent Rs 125 million raise is intended to fund the next phase of scale and to demonstrate that industrial waste can become a dependable input for lower carbon construction.
In a research-backed article, Dr SB Hegde examines why carbon-adjusted profitability and LC3 will decide the next set of winners in cement manufacturing.
The Indian cement industry has achieved world-class operational efficiency through lower specific energy consumption, high plant utilisation and a reduced average clinker factor of approximately 67.5 per cent. These traditional measures of operational excellence remain essential. However, they are no longer sufficient. Carbon now carries a measurable financial cost under India’s Carbon Credit Trading Scheme (CCTS) and under European carbon markets. Future leadership will be defined by carbon-adjusted profitability, the ability to generate strong returns while systematically lowering the carbon intensity of every ton sold.
Limestone calcined clay cement (LC3) offers a practical, scalable pathway to achieve this dual objective. By replacing up to 50 per cent of clinker with calcined clay and limestone, LC3 can reduce CO2 emissions by 30–40 per cent while delivering comparable or superior durability performance.
This article examines the technical foundations of LC3, European industrial practices, the emerging Indian carbon market and a concrete roadmap for Indian companies to embed carbon-adjusted metrics and LC3 into daily operations, incentives and commercial strategy.
Limits of traditional operational excellence
For many years, plant performance has been judged primarily by five indicators: specific heat consumption, specific power consumption, kiln and mill utilisation, clinker factor and overall equipment effectiveness. These metrics drove continuous improvement and helped the industry reduce energy use and increase the share of blended cement. Three structural changes have rendered them incomplete as sole measures of success.
First, carbon now carries a real or opportunity cost. Plants that improve volume or lower cash cost while raising or stagnating emissions intensity create a hidden liability that will surface as CCTS trading matures and as green procurement expands.
Second, lower-carbon products such as LC3 and high-performance blended cements are creating differentiated market segments. Customers in infrastructure, real estate and export-oriented construction are beginning to specify embodied-carbon limits.
Third, investors and lenders increasingly treat carbon intensity as a financial risk factor. Traditional KPIs can mask the divergence between short-term cash profit and long-term carbon-adjusted value.
What is carbon-adjusted profitability?
Carbon-adjusted profitability evaluates normal profit after explicit adjustment for carbon performance. A practical expression is:
Carbon-Adjusted EBITDA = Conventional EBITDA – Carbon Cost + Green Premium Income
Carbon cost may be an internal carbon price, the actual cost of purchasing Carbon Credit Certificates under CCTS, or the opportunity cost of high emissions relative to peers. Green premium income arises when customers pay more for verified lower-carbon cement or when the company sells surplus credits. Tracking both conventional and carbon-adjusted profit side-by-side gives management a clearer picture of value creation under evolving market rules.
Table 1. Traditional KPIs versus Carbon-Adjusted Leadership Metrics
Traditional Focus New Leadership Metric Why It Matters
Specific energy consumption Emissions intensity (kg CO2/t cement) Directly linked to future CCTS and CBAM costs
Kiln utilisation Carbon-adjusted contribution margin Reveals true value of incremental volume
Clinker factor Share of lower-carbon products sold (incl. LC3) Measures commercial success of the transition
Power cost per tonne Effective carbon cost per tonne sold Expose hidden liabilities
Absolute EBITDA Carbon-adjusted EBITDA + green premium Aligning profit with future market reality
LC3: Technical foundations and performance advantages
LC3 is a ternary blended cement that typically combines approximately 50 per cent clinker, 30 per cent calcined clay, 15 per cent limestone and 5 per cent gypsum (the classic LC3-50 formulation). The decisive technical advantage is that clay is calcined at 700–850 °C, far below the 1,450 °C required for clinker production. This lower temperature, together with the substantial reduction in clinker content, delivers CO2 reductions of 30–40 per cent relative to ordinary Portland cement (OPC).
Chemistry is synergistic. Calcined kaolinitic clay (metakaolin) reacts with calcium hydroxide from clinker hydration and with limestone to form additional C-A-S-H gel and carboaluminate phases. These phases densify the microstructure, reduce porosity and improve durability.
Field experience shows superior resistance to chloride ingress, sulphate attack and alkali–silica reaction. Early-age strength can match OPC with high-reactivity clays; later-age strengths routinely meet 42.5 and 52.5 grade requirements.
Importantly, LC3 does not require high-purity kaolin. Clays with 40 per cent or even lower kaolinite content can be activated successfully, expanding raw-material availability across India. Calcination can use adapted rotary kilns or dedicated flash calciners, making the technology compatible with existing plant infrastructure and far less capital-intensive than carbon capture.
Economic analyses show that LC3 can be produced at equal or lower cost than OPC in many locations because of reduced energy demand and cheaper clay. Life-cycle assessments consistently report 30–40 per cent lower embodied CO2 per tonne of cement.
Table 2. Comparative profile: OPC versus LC3-50
Parameter OPC LC3-50
Typical clinker content ~95 per cent ~50 per cent
CO2 emissions (relative) Baseline (≈0.85 t CO2/t cement process + fuel) 30–40 per cent lower
Clay calcination temperature Not applicable 700–850 °C
Key hydration products C-S-H, portlandite, ettringite C-A-S-H + carboaluminates
Chloride & sulphate resistance Good Superior
Production cost potential Baseline Equal or lower in most locations
Infrastructure compatibility Existing High (minor adaptations)
In India, commercial adoption has begun in earnest. JK Cement commenced the first commercial production of LC3 in the Indian subcontinent at its Mangrol plant in Rajasthan in 2025 under BIS standard IS 18189.
By early 2026, approximately 2,000 tonnes had been produced and sold, avoiding an estimated 500 tonnes of CO2. JK Lakshmi Cement followed with commercial launch of its Green PRO LC3 grade from the Jaykaypuram plant. As of mid-2026, two producers are supplying LC3 to the market. The first large-scale infrastructure application is the Noida International Airport (Jewar), where LC3 was used in the runway and a building complex, demonstrating full constructability and performance under demanding conditions. These early volumes are still small relative to national cement demand, but they mark the critical transition from pilot to commercial reality. Companies that scale capacity now will be positioned to capture both CCTS credits and emerging green-procurement demand.
Why the shift is accelerating
According to the World Bank’s State and Trends of Carbon Pricing 2026, direct carbon pricing now covers nearly 30 per cent of global greenhouse-gas emissions and generated more than US$107 billion in public revenue in 2025. The average global carbon price stands at approximately US$21 per tonne, although regional prices vary widely.
In Europe, the EU ETS price has traded near €80–85 per tonen in mid-2026. Free allocation for cement is being withdrawn in parallel with CBAM. European producers therefore face a clear signal: every tonne of avoided CO2 improves both compliance and competitiveness. Holcim has scaled calcined-clay production, including Europe’s first dedicated line at Saint-Pierre-la-Cour (France) and a second line in the Czech Republic (2026). Heidelberg Materials, Cementir (FUTURECEM) and others have commercialised low-clinker calcined-clay blends across multiple markets, showing that carbon-adjusted profitability is already reshaping capital allocation in the world’s most mature carbon market.India’s CCTS is now operational. Binding emission intensity targets apply to 186 cement facilities for FY 2025–26 and FY 2026–27. Average required reductions for integrated plants are modest (around 2.7 per cent by FY 2027), yet the direction is clear.
Trading of Carbon Credit Certificates is expected in the second half of 2026, with early prices likely in the `800–1,500 per tonne range. Plants that outperform targets can sell credits; those that underperform must buy them or face compensation. Cement is well positioned to be a net supplier of credits if clinker factor continues to fall through LC3 and other low-clinker systems.
Way forward for India
India starts from a strong baseline, world-class energy efficiency and a clinker factor already lower than the global average. The next competitive frontier is the deliberate reduction of process emissions through clinker substitution at scale. LC3 is uniquely suited to Indian conditions because suitable clays are widely distributed, the technology fits existing kiln and grinding infrastructure, and the resulting product can meet the performance demands of both infrastructure and building construction.
A practical national pathway contains five interlocking elements:
- Standards and acceptance: Accelerated finalisation and promotion of BIS specifications for calcined-clay and limestone–calcined-clay cements will remove a key barrier to commercial uptake. Alignment with European practice (EN 197-5) can facilitate knowledge transfer and export readiness.
- Supply-chain development: Investment in flash calcination capacity and systematic characterisation of regional clay deposits will secure reliable, low-cost feedstock. Existing rotary kilns can be adapted for initial volumes while dedicated calciners are built.
- Incentive alignment: Part of variable compensation for plant managers, sales teams and senior leadership should be linked to emissions intensity reduction and to the volume of lower-carbon products (including LC3) sold. Without this link, traditional volume and cost targets will continue to dominate behaviour.
- Product-level carbon accounting: Reliable measurement of emissions intensity at the individual cement grade level, supported by third-party verification where required, is essential for both CCTS compliance and credible green claims.
- Demand-side pull: Green public procurement policies that specify maximum embodied-carbon thresholds for major infrastructure projects will create a predictable market for LC3 and other low-carbon cements, accelerating scale and cost reduction.
Companies that treat LC3 as a strategic product line rather than a niche offering will be better positioned to generate surplus Carbon Credit Certificates, capture any emerging green premium, and protect margins as carbon costs rise.
Organisational changes required
Technical capability alone is insufficient. Three organisational shifts are required.
Daily management: Emissions intensity must appear on the same daily and monthly dashboards as heat consumption, power consumption and utilization. Plant reviews should examine both conventional and carbon-adjusted results.
Incentives: A meaningful portion of bonuses for plant heads, technical teams and sales leadership should be tied to lower emissions intensity and successful commercialisation of LC3 and other low-carbon grades.
Commercial approach: Sales teams need clear volume and pricing targets for lower-carbon products, supported by technical service that helps customers specify and place the material correctly. Without commercial pull, excellent technical performance remains under-utilised.
Table 3. Three-stage roadmap to carbon-adjusted profitability
Time Horizon Priority Actions Expected Outcome
Next 12 months Add emissions intensity to plant dashboards; establish internal carbon price; initiate LC3 pilot production and customer trials Visibility and early organisational learning
12–24 months Revise incentive systems; scale LC3 and other low-carbon grades to key accounts; secure third-party verification capability People and sales aligned with carbon goals
24–36 months Embed carbon-adjusted metrics in board reporting and capital allocation; expand calcined-clay capacity Full system integration and competitive advantage
Questions senior leaders should ask
Boards can accelerate the transition by insisting on answers to a short list of questions:
• Is our carbon-adjusted profit improving, stable or declining relative to conventional EBITDA?
• Did recent volume growth improve or worsen our emissions intensity?
• What share of sales already comes from lower-carbon products, including LC3, and what is the trajectory?
• How exposed is our capital expenditure plan to rising carbon costs under CCTS and potential CBAM-related requirements?
• Do our incentive systems still reward only volume and cost, or have they been updated to include carbon performance?
Treating carbon with the same seriousness as energy cost or kiln utilization does not diminish operational excellence; it expands the definition of excellence to match the new competitive reality.
Looking ahead
By 2030 the gap between leading and lagging cement companies will not be decided by who records the lowest specific heat consumption. It will be decided by who delivers the strongest carbon-adjusted profits.
Absolute emissions may still rise as national production grows. That is not the issue. Companies that reduce intensity year after year and successfully sell cleaner products will pull ahead in both domestic and export markets. Those that do not will fall behind, even if their traditional efficiency numbers look strong.
Operational excellence built the Indian cement industry. It remains the foundation. It is no longer the complete picture. Carbon-adjusted profitability is the clearer measure of success.
LC3 is not a distant technology. It is available now. It cuts CO3 by 30–40 per cent, works with existing plants, and is already in commercial production in India. Companies that treat it as a strategic product, not a pilot, will protect their margins and generate tradable credits.
Leaders who act now will place carbon metrics on daily dashboards, link incentives to intensity reduction and LC3 sales, invest in calcined-clay capacity, and build commercial capability to sell lower-carbon products. They will shape the next chapter of the industry.
References
- World Bank. (2026). State and Trends of Carbon Pricing 2026. Washington, DC: World Bank Group.
- International Carbon Action Partnership (ICAP). (2026). India Carbon Credit Trading Scheme – Status and Coverage. Berlin: ICAP.
- Ministry of Environment, Forest and Climate Change / Bureau of Energy Efficiency. (2025). Greenhouse Gases Emission Intensity Target Rules, 2025. New Delhi: Government of India.
- Scrivener, K., Martirena, F., Bishnoi, S., & Maity, S. (2018). Calcined clay limestone cements (LC3). Cement and Concrete Research, 114, 49–56.
- RMI. (2024). The Business Case for LC3. Rocky Mountain Institute.
- European Commission. (2026). EU Emissions Trading System – Allowance Price Data and Free Allocation Phase-out Schedule. Brussels.
- Holcim. (2025–2026). Scaling Calcined Clay for Sustainable Building – Corporate Updates on European and Latin American Capacity. Zurich: Holcim Ltd.
- LC3 Project / EPFL. (2026). LC3 – A Guide to Best Practices for Scalable, Affordable and Sustainable Low-Carbon Building. Lausanne: École Polytechnique Fédérale de Lausanne.
- Business Today / Industry Reports. (2026). First Large-Scale LC3 Application at Noida International Airport, Jewar. New Delhi.
- NITI Aayog / Industry Analyses. (2026). Roadmap and Baseline Performance Indicators for the Indian Cement Sector. New Delhi.
- Springer / Innovative Infrastructure Solutions. (2026). LC3 Systems: A Review of Chemistry, Performance, Durability and Sustainability toward Market Adoption.
- Cementir Holding / Industry Sources. (2025–2026). FUTURECEM and Related Low-Clinker Technologies in Europe.
- Climate Risk Horizons & Independent Analyses. (2026). Assessment of Emission Intensity Targets under India’s CCTS for Cement and Other Hard-to-Abate Sectors.
- GCCA / TERI. (Various years). Decarbonization Roadmaps for the Indian Cement Industry.
- EN 197-5:2021. Cement – Part 5: Portland-composite cement CEM II/C-M and Composite cement CEM VI. European Committee for Standardization.
Concrete
More Oversight Makes Cement Plants Less Safe
Published
3 days agoon
August 28, 2026By
admin
Dijam Panigrahi makes a counterintuitive but data-backed argument that routing every sensor alert through human approval does not make cement plants safer.
India’s cement industry has spent the last two years wiring kilns, mills and coolers with sensors and automated control systems, and the safety case for doing so is strong on paper. Contract workers still make up the majority of the industry’s workforce, and fatal accidents remain a recurring problem. The Indian National Cement Workers Federation has noted that around 83 per cent of workers in the sector hold precarious positions, a fact that resurfaced after an oxygen cylinder explosion killed three contract workers at a plant in Chhattisgarh.
Industry tallies compiled by IndustriALL found cement plants recorded at least seventeen accidents in one year with 21 workers killed, and ten accidents the following year with nine killed, most of them contract staff. Automated monitoring, in theory, closes that gap. A sensor never gets complacent and never skips a check because a shift is short staffed.
However, plants that respond by routing every anomaly reading to a person for approval are quietly building a system that fails the same way understaffing does. When operators receive dozens of flagged deviations a shift, most of them minor, they learn a simple lesson: the fastest way through the queue is to approve without reading closely. The safety benefit disappears, not because the technology failed, but because the humans supervising it adapted to the volume.
Why alerts get ignored
A study cited by manufacturing technology publisher Applied SmartFactory found more than 95 per cent of alarms in a semiconductor fab were low priority, and only about 4 per cent ever triggered an action, with just 100 out of 5,000 alarms accounting for 70 per cent of all alarm activity. The mechanism is the same whether the trigger is a vibration sensor or an AI model flagging a kiln temperature swing. Once the ratio of noise to signal crosses a threshold, workers stop treating the system as a decision aid and start treating it as a formality to clear.
The scale of AI deployment underway makes this more than a theoretical risk. Stanford’s 2026 AI Index Report found organisational adoption of AI has reached 88 per cent, even as documented AI incidents rose to 362 in 2025, up sharply from 233 the year before, according to analysis of the report. The Index also found only about a third of organisations have adopted a formal governance framework, with NIST’s AI Risk Management Framework cited by 33 per cent and ISO/IEC 42001 cited by 36 per cent.
Most manufacturers are deploying monitoring systems faster than they are building the judgment for when a flagged event actually needs a person’s attention. In India, plants run by JK Cement have begun pairing CCTV feeds with AI to define safe zones around heavy machinery, a promising direction that still depends on operators trusting and reading the alerts the system generates.
A three-tier model for cement plant
The fix is not less monitoring or more monitoring. It is classifying decisions by risk and by novelty, rather than treating human oversight as a single switch that is either on or off. A workable model sorts factory floor events into three tiers.
The first tier, proceed, covers deviations the plant has seen before that fall within known safe bounds, such as a kiln feed rate adjustment within an established range. These should run without a stop for approval, because routing them to a person only trains that person to click through.
The second tier, pause, covers events that are unusual but not yet dangerous, such as a vibration reading trending toward a limit or a fuel blend shifting outside its typical mix. These warrant a brief human check before the system proceeds, giving an operator the chance to apply judgment the model does not yet have.
The third tier, escalate, covers events that are both high risk and unfamiliar, such as a pressure reading combined with a temperature spike that has no close precedent in the plant’s history. These should stop the process entirely and require a decision from someone with the authority to shut down a line.
Who should set the threshold
Where these tiers get drawn matters as much as the framework itself. Threshold setting is frequently handed to the vendor supplying the monitoring software or to a plant’s IT department, both of which understand the technology but not the specific tolerances of a given kiln, mill or line. Operations staff, who know that a particular grinding unit runs hotter under monsoon humidity or that a calciner behaves differently after a refractory reline, are better positioned to calibrate what counts as routine on their own equipment.
Handing threshold ownership to operations does not remove IT or vendors from the process, but it puts the calibration decision closest to the people who live with its consequences on the floor.
Signals that oversight is actually working
A few concrete indicators reveal whether a monitoring setup is functioning as intended or simply providing the appearance of safety. The escalation rate over time is the first: a rate that stays flat or climbs slowly as operations mature is healthy, while one that spikes and then falls sharply often means operators have started overriding the system rather than engaging with it. Time to resolution is the second: escalations that take progressively longer to close suggest fatigue or confusion about ownership, not diligence. The third, and most telling, is how accurate the system’s own uncertainty estimates turn out to be, meaning whether events flagged as high risk actually correlated with real incidents, and whether events waved through stayed incident free. A system whose escalations do not track with actual outcomes trains operators toward the same complacency that unmonitored equipment produces.
None of this argues against automation in Indian cement manufacturing, where a labor structure built on contract work and a track record of serious accidents make better monitoring an urgent need. It argues for treating human oversight as a design problem with three distinct settings, rather than a single
dial turned up whenever a plant wants to look safer on paper.
About the author:
Dijam Panigrahi, Co-founder and COO, GridRaster, is a spatial computing platform for industrial enterprises and manufacturers.
CarbonStrong Raises Rs 125 Million To Scale Low Carbon Cement Tech
Protect Your Margins
More Oversight Makes Cement Plants Less Safe
The biggest gap arises from inconsistent leadership
The Future of Vertical Material Handling
CarbonStrong Raises Rs 125 Million To Scale Low Carbon Cement Tech
Protect Your Margins
More Oversight Makes Cement Plants Less Safe
The biggest gap arises from inconsistent leadership