Technology
Intelligent Optimisation

The most important physical property of particulate samples is particle size. Particle size measurement is routinely carried out across a wide range of industries and is often a critical parameter in the manufacture of many products.
In the quest to optimise our cement production processes, we must understand the process itself, in terms of what we are producing and what we are producing it from.
Why measure particle properties?
There are two main reasons why many industries routinely employ particle characterisation techniques:
Better control of product quality
In an increasingly competitive global economy, better control of product quality delivers real economic benefits such as:
- ability to charge a higher premium for your product;
- reduce customer rejection rates and lost orders;
- demonstrate compliance in regulated markets.
Better understanding of products, ingredients and processes
In addition to controlling product quality, a better understanding of how particle properties affect your products, ingredients and processes will allow you to:
- improve product performance;
- troubleshoot manufacturing and supply issues;
- optimise the efficiency of manufacturing processes;
- increase output or improve yield;
- stay ahead of the competition;
Particle Properties
Particle size
By far the most important physical property of particulate samples is particle size. Particle size measurement is routinely carried out across a wide range of industries and is often a critical parameter in the manufacture of many products. Particle size has a direct influence on material properties such as:
- reactivity or dissolution rate;
- stability in suspension;
- efficacy of application;
- texture and feel;
- appearance;
- flowability and handling;
- packing density and porosity.
Measuring particle size and understanding how it affects your products and processes can be critical to the success of many manufacturing businesses.
What to do with particle size data
In order to simplify the interpretation of particle size distribution data, a range of statistical parameters can be calculated and reported. The choice of the most appropriate statistical parameter for any given sample will depend upon how that data will be used and with what it will be compared. For example, if you wanted to report the most common particle size in your sample, you could choose between the following parameters:
- Mean – ?average, size of a population;
- Median – size in the middle of a frequency distribution;
- Mode – size with highest frequency.
If the shape of the particle size distribution is asymmetric, as is often the case for many samples, you would not expect these three parameters to be exactly equivalent, as illustrated in Figure 1.
Means
There are many different means that can be defined, depending upon how the distribution data is collected and analysed. The three most commonly used for particle sizing are described below.
Number length mean D[1,0] or Xnl
The number length mean, often referred to as the arithmetic mean, is most important when the number of particles is of interest, e.g., in particle counting applications. It can only be calculated if we know the total number of particles in the sample, and is therefore limited to particle counting applications.
Surface area moment mean D[3, 2] or Xsv
The surface area mean (Sauter Mean Diameter) is most relevant when the specific surface area is important e.g., bioavailability, reactivity, dissolution. It is most sensitive to the presence of fine particulates in the size distribution.
Volume moment mean D[4, 3] or Xvm
The volume moment mean (De Brouckere Mean Diameter) is relevant for many samples as it reflects the size of those particles which constitute the bulk of the sample volume. It is most sensitive to the presence of large particulates in the size distribution.
An example of the surface area and volume moment means is shown in the particle size distribution below. If the aim is to monitor the size of the coarse particulates that make up the bulk of this sample, then the D[4,3] would be most appropriate. If, on the other hand, it is actually more important to monitor the proportion of fines present, then it might be more appropriate to use the D[3,2].
Percentiles
For volume-weighted particle size distributions, such as those measured by laser diffraction, it is often convenient to report parameters based upon the maximum particle size for a given percentage volume of the sample.
Percentiles are defined as XaB where:
- X= parameter, usually D for diameter
- a = distribution weighting, e.g., n for number, v for volume, i for intensity
- B = percentage of sample below this particle size e.g. 50 per cent, sometimes written as a decimal fraction i.e., 0.5
For example, the Dv50 would be the maximum particle diameter below which 50 per cent of the sample volume exists – also known as the median particle size by volume. The most common percentiles reported are the Dv10, Dv50 and Dv90, as illustrated in the frequency and cumulative plots in Figure 2.
By monitoring these three parameters, it is possible to see if there are significant changes in the main particle size, as well as changes at the extremes of the distribution, which could be due to the presence of fines, as shown in the particle size distribution in Figure 3, or oversized particles/agglomerates.
Particle shape
As well as particle size, the shape of constituent particles can also have a significant impact upon the performance or processing of particulate materials. Many industries are now also making particle shape measurements in addition to particle size measurements in order to gain a better understanding of their products and processes.
How do we define particle shape?
Particles are complex three-dimensional objects and, as with particle size measurement, some simplification of the description of the particle is required in order to make measurement and data analysis feasible. Particle shape is most commonly measured using imaging techniques, where the data collected is a two-dimensional projection of the particle profile. Particle shape parameters can be calculated from this two-dimensional projection using simple geometrical calculations.
Particle form
Aspect ratio can be used to distinguish between particles that have regular symmetry, such as spheres or cubes, and particles with different dimensions along each axis, such as needle shapes or ovoid particles. Other shape parameters that can be used to characterise particle form include elongation and roundness.
Particle outline
As well as enabling the detection of agglomerated particles, the outline of a particle can provide information about properties such as surface roughness. Particles with very smooth outlines will have a convexity/solidity value close to 1, whereas particles with rough outlines, or agglomerated primary particles, will have consequently lower convexity/solidity values.
Universal shape parameters
Some shape parameters capture changes in both particle form and outline. Monitoring these can be useful where both form and outline may influence the behaviour of the material being measured. The most commonly used parameter is circularity. Circularity is often used to measure how close a particle is to a perfect sphere, and can be applied in monitoring properties such as abrasive particle wear. However, care should be exercised in interpreting the data, since any deviations could be due to either changes in surface roughness or physical form, or both.
While circularity can be very useful for some applications, it is not suitable for all situations. To date, there is no definition of a universal shape parameter that will work in every case. In reality, careful consideration is necessary to determine the most suitable parameter for each specific application.
Summary
This article touches the surface of the different means we have at our disposal to analyse particle properties. Such information can be used to optimise and refine our cement production processes, increasing the efficiency and product quality.


(This article has been authored by Dr Michael Caves, Malvern Aimil Instruments Pvt Ltd, New Delhi).


Jignesh Kundaria, Director and CEO, Fornnax Technology
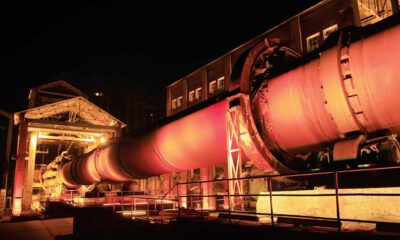
India is simultaneously grappling with two crises: a mounting waste emergency and an urgent need to decarbonise its most carbon-intensive industries. The cement sector, the second-largest in the world and the backbone of the nation’s infrastructure ambitions, sits at the centre of both. It consumes enormous quantities of fossil fuel, and it has the technical capacity to consume something else entirely: the waste our cities cannot get rid of.
According to CPCB and NITI Aayog projections, India generates approximately 62.4 million tonnes of municipal solid waste annually, with that figure expected to reach 165 million tonnes by 2030. Much of this waste is energy-rich and non-recyclable. At the same time, cement kilns operate at material temperatures of approximately 1,450 degrees Celsius, with gas temperatures reaching 2,000 degrees. This high-temperature environment is ideal for co-processing, ensuring the complete thermal destruction of organic compounds without generating toxic residues. The physics are in our favour. The infrastructure is not.
Pre-processing is not the support act for co-processing. It is the main event. Get the particle size wrong, get the moisture wrong, get the calorific value wrong and your kiln thermal stability will suffer the consequences.
The Regulatory Push Is Real
The Solid Waste Management (SWM) Rules 2026 mandate that cement plants progressively replace solid fossil fuels with Refuse-Derived Fuel (RDF), starting at a 5 per cent baseline and scaling to 15 per cent within six years. NITI Aayog’s 2026 Roadmap for Cement Sector Decarbonisation targets 20 to 25 per cent Thermal Substitution Rate (TSR) by 2030. Beyond compliance, every tonne of coal replaced by RDF generates measurable carbon reductions which is monetisable under India’s emerging Carbon Credit Trading Scheme (CCTS). TSR is no longer a sustainability metric. It is a financial lever.
Yet our own field assessments across multiple Indian cement plants reveal a sobering reality: the primary barrier to scaling AFR adoption is not waste availability. It is the fragmented and under-engineered pre-processing ecosystem that sits between the waste and the kiln.
Why Indian Waste Is a Different Engineering Problem
Indian municipal solid waste is not the material that imported shredding equipment was designed for. Our waste streams frequently exceed 40 per cent to 50 per cent moisture content, particularly during monsoon cycles, saturated with abrasive inerts including sand, glass, and stone. Plants relying on imported OEM equipment face months of downtime awaiting proprietary spare parts. Machines built for segregated, low-moisture waste fail quickly and disrupt the entire pre-processing operation in Indian conditions.
The two most common failures we observe are what I call the biting teeth problem and the chewing teeth problem. Plants relying solely on a primary shredder reduce bulk waste to large fractions, but the output remains too coarse for stable kiln combustion. Others attempt to use a secondary shredder as a standalone unit without a primary stage to pre-size the feed, leading to catastrophic mechanical failure. When both stages are present but mismatched in throughput capacity, the system becomes a bottleneck. Achieving the 40 to 70 tonnes per hour required for meaningful coal displacement demands a precisely coordinated two-stage process.
Engineering a Made-in-India Answer
At Fornnax, our response to these challenges is grounded in one principle: Indian waste demands Indian engineering. Our systems are built around feedstock homogeneity, the holy grail of kiln stability. Consistent particle size and predictable calorific value are the foundation of stable kiln combustion. Without them, no TSR target is achievable at scale.
Our SR-MAX2500 Dual Shaft Primary Shredder (Hydraulic Drive) processes raw, baled, or loosely mixed MSW, C&I waste, bulky waste, and plastics, reducing them to approximately 150 mm fractions at throughputs of up to 40 tonnes per hour. The R-MAX 3300 Single Shaft Secondary Shredder (Hydraulic Drive), introduced in 2025, takes that primary output and produces RDF fractions in the 30 to 80 mm range at up to 30 tonnes per hour, specifically optimised for consistent kiln feeding. We have also introduced electric drive configurations under the SR-100 HD series, with capacities between 5 and 40 tonnes per hour, already operational at a leading Indian waste-processing facility.
Looking ahead, Fornnax is expanding its portfolio with the upcoming SR-MAX3600 Hydraulic Drive primary shredder at up to 70 tonnes per hour and the R-MAX2100 Hydraulic drive secondary shredder at up to 20 tonnes per hour, designed specifically for the large-scale throughput that higher TSR ambitions require.
The Investment Case Is Now
The 2070 Net-Zero target is not a distant goal for India’s cement sector. It starts today, with decisions being made on the plant floor.
The SWM Rules 2026 are already in effect, requiring cement plants to replace coal with RDF. Carbon credit markets are opening up, and coal prices are not going to get cheaper. Every tonne of coal a cement plant replaces with waste-derived fuel saves money on one side and generates carbon credit revenue on the other. Pre-processing infrastructure is no longer just a compliance requirement. It is a business investment with a measurable return.
The good news is that nothing is missing. The technology works. The waste is available in every Indian city. The government has provided the policy direction. The only thing standing between where the industry is today and where it needs to be is the commitment to build the right infrastructure.
The cement companies that move now will not just meet the regulations. They will be ahead of every competitor that waits.
About The Author
Jignesh Kundaria is the Director and CEO of Fornnax Technology. Over an experience spanning more than two decades in the recycling industry, he has established himself as one of India’s foremost voices on waste-to-fuel technology and alternative fuel infrastructure.


Cement Makers Reaffirm Commitment to Sustainable Growth

Building a Greener Future Together

JK Lakshmi Advances LC3 Cement Expansion

Burnpur Cement Reports Standalone Net Loss Of Rs 207.4 Million

Ramco Cements Campaign Wins Six Kyoorius Honours
Cement Makers Reaffirm Commitment to Sustainable Growth
Building a Greener Future Together
JK Lakshmi Advances LC3 Cement Expansion
Burnpur Cement Reports Standalone Net Loss Of Rs 207.4 Million