Economy & Market
On the Path of Transformation

Published
8 years agoon
By
admin
The logistics sector is fundamental to the development of a country. Logistics is a sector where the trend is determined by the country’s overall economic performance.
Logistics including transportation, inventory management, warehousing, materials handling and packaging, and integration of information, is related to management of flow of goods between the point of origin and the point of consumption. With the growing Indian economy and changing business perspectives, the scope of the logistics industry has broadened from rudimentary transportation of goods to include end-to-end supply chain solutions including warehousing and express delivery.
The Indian logistics industry was estimated to be approximately $160 billion in FY17. The key segments include road, rail, coastal, warehousing, cold chain and container freight stations and inland container depots (CFS/ICD). The domestic logistics market is expected to grow at a CAGR of approximately 10 per cent. Indian logistics market is expected to be driven by the growth in the manufacturing, retail, FMCG and e-commerce sectors.
Development of logistics-related infrastructure such as dedicated freight corridors, logistics parks, free trade warehousing zones, and container freight stations are expected to improve efficiency. The industry is dominated by transportation, which accounts for over 85 per cent of total value, and its share is expected to remain high over the next few years. The sector provides employment to more than 22 million people. Improving logistics sector has significant bearing on exports and media sources estimate that a 10 per cent decrease in indirect logistics cost could potentially increase 5 to 8 per cent of exports.
Of the various modes of transportation, roads and railway are the most preferred mode accounting for approximately 60 per cent and 30 per cent of the total cargo volumes handled, respectively. The share of other transportation modes comprising Inland shipping, pipelines and airways remains minimal accounting for the balance 10 per cent. The higher transportation costs in India can be associated with poor road infrastructure leading to lowering of the maximum distance that can be covered by any commercial vehicle, old vehicles fleet and higher cess and toll on the highways while the higher warehousing costs are on account of shortage of warehousing capacity in India, non-standardisation of warehouses in terms of IT application, etc.
As per the Ministry of Road Transport and Highways, India’s logistics cost as a per cent of GDP stood at 13-14 per cent compared to 10- 11 per cent for BRIC countries and 8-9 per cent for developed countries. The US spends 9.5 per cent and Germany 8 per cent of their GDP on logistics costs. A significant proportion of the higher cost can be attributed to the absence of an efficient intermodal and multimodal transport systems. Going forward, the logistics cost as a per cent of GDP for India is expected to decline driven by initiatives such as implementation of GST, investments towards road infrastructure, development of inland waterways and coastal shipping, thrust towards dedicated freight corridors, etc.
Currently the Indian logistics industry is highly fragmented and unorganised. Owing to the presence of numerous unorganised players in the industry, it remains fragmented with the organised players accounting for approximately 10 per cent of the total market share. With the consumer base of the sector encompassing a wide range of industries including retail, automobile, telecom, heavy industries, etc., logistics industry has been increasingly attracting investments in the last decade.
The sector is facing challenges such as under-developed material handling infrastructure, fragmented warehousing, multiple regulatory/policymaking bodies, lack of seamless movement of goods across modes, minimal integrated IT infrastructure. In order to develop this sector focus on new technology, improved investment, skilling, removing bottlenecks, improving intermodal transportation, automation, single-window system for giving clearances, and simplifying processes would be required.
Global scenario
Warehousing primarily refers to the storage of goods to be transported, whether inbound or outbound. The warehousing industry includes establishments operating warehousing and storage facilities for general merchandise, refrigerated goods and other warehouse products. Warehouses are one of the major segments of the rapidly growing logistics industry. Currently the segment has evolved from providing not only custody for goods but also offering value added services such as sorting, packing, blending and processing. With evolution of an organised retail sector modern warehouses for the storage of perishable goods have become indispensable In 2017, the global warehousing and storage market was estimated to be around $475 billion. The global warehousing and storage accounted for approximately 8 per cent of the overall logistics market in 2017. The warehousing and storage market was the fifth largest market in the global logistics market in 2017. North America is the largest geographic region accounting for nearly 28 per cent of the global market.
Globally, warehousing has moved ahead from single storey to multi-story warehouses in densely populated cities and expensive land spaces. A multi-story warehouse consists of more than one floor and is designed to increase the available floor space. It results in better land utilisation rate and enhances operational efficiency. Multi-story warehouses have been successful in densely populated cities predominantly in Asian countries such as China, Japan, Hong Kong and Singapore, due to high land and construction costs, small site areas and limited industrial land availability.
Domestic scenario
The warehousing market in India is highly fragmented with most warehouses having an area of less than 10,000 sq.ft. Approximately 90 per cent of the warehousing space in the country is controlled by unorganised players with smaller sized warehouses which have limited mechanisation. Fragmented warehousing footprint results in higher average inventory holding, in addition to resulting in higher storage and handling losses, driven by lower level of mechanisation.
Warehouses have become one of the major segments of the rapidly growing Indian logistics industry. Today they do not only provide custody for goods but also offer value added services such as sorting, packing, blending and processing. With evolution of an organised retail sector modern warehouses for the storage of perishable goods have become essential. The government’s initiatives to promote the growth of warehouses in the country through measures such as enactment of the Warehousing Act, 2007, investments in the establishment of logistic parks and Free trade warehouse zones (FTWZs) together with the introduction of Goods & Service Tax (GST) regime augurs well for the industry’s growth. Sensing the tremendous growth potential of the warehouse sector, the private players (including both domestic and international) have ventured with a view to bridge the gap between cost and efficiency of operations.
Nearly 60 per cent of the modern warehousing capacity in India is concentrated in the top six cities namely Ahmedabad, Bangalore, Chennai, Mumbai, NCR and Pune, with Hyderabad and Kolkata being the other major markets. This is driven by concentration of industrial activity and presence of sizeable urban population around these clusters. Going forward, due to factors like quality of infrastructure and availability of labour, these advantages are likely to remain with these cities. In all the segments of warehousing industry barring the agricultural segment, the majority of the capacity is controlled by the private sector. In the agricultural segment, approximately three-fourth is controlled by different government entities. The primary objective of a majority of these warehouses is to only store food grains and ensure food security.
Types of warehouses
Traditionally, warehouses were broadly classified into public-private, bonded, government and co-operative warehouses. Lately, cold chains, container freight stations (CFS) and inland container depots (ICD) are gaining importance.
Private warehouses: These warehouses are owned by private entities or individuals and are used exclusively for the goods owned, imported by or on behalf of the licensee. The warehouses are usually constructed at strategic locations to cater various manufacturing, business and service units. They are flexible enough to be customised in terms of storage and placement, according to the nature of the products.
Public warehouses: These Warehouses are licensed by the government to private entities, individual or cooperative societies to store goods of the general public. They are rented out against a fee and usually set up at transportation points of railways, highways and waterways, providing the facilities of receipt, dispatch, loading and unloading of goods. The government also regulates the functions and operations of these warehouses used mostly by manufacturers, wholesalers, exporters, importers, government agencies, etc.
Bonded warehouses: These warehouses are licenced by the Government to accept imported goods for storage until the payment of customs duty. They are located near the ports. They are either operated by the Government or work under the control of customs authorities. The warehouse is required to give an undertaking or "Bond" that it will not allow the goods to be removed without the consent of the custom authorities. The goods are held in bond and cannot be withdrawn without paying the customs duty. Such warehouses are very helpful to importers and exporters. If an importer is unable to pay customs duty immediately after the arrival of goods he can store the goods in a bonded warehouse. He can withdraw the goods in instalments by paying the customs duty proportionately. Goods lying in a bonded warehouse can be packaged, graded and branded for the purpose of sale.
Container freight stations (CFS)/inland container depots (ICDs): CFSs/ICDs are custom-bonded facility with public authority status for the handling and storage for containers. These depots equipped with warehousing space, adequate handling equipment and IT infrastructure.
Cold storage: A cold storage is a temperature controlled storage space catering mainly to agriculture and food industries. Cold stores are used for the storage and distribution of perishable goods such as fruits and vegetables, dairy products; frozen foods such as meat and ice cream, and temperature-sensitive pharmaceutical products. Given that India is primarily an agriculture country, cold storage has huge potential in India.
Government storage: The primary objectives of any government storage are 1) to ensure food security, and 2) enable trade movement both within and out of the country. Consequently, the Central Warehousing Corporation operates 431 warehouses (storage capacity of 100.28 lakh MT) including 44 custom bonded warehouses, 29 CFSs/ICDs, 3 air cargo complexes (ACCs) (5,961 MT) and 3 cold storage warehouses (2,419 MT). Further, various State Warehousing Corporations (SWC) manage a total capacity of 283.34 MT across 1,831 warehouses. The Food Corporation of India (FCI) works for holding agricultural produce to meet the requirements of various government schemes. FCI has its own storage capacity but also hires capacities from CWC, SWCs and the private sector.
Cold storage: There are over 7,700 cold storage warehouses with a capacity of over 36 million MT in India with a significant portion of the facilities being privately owned. India’s cold storage capacity is unorganised and dominated by traditional cold storage facilities. The distribution of cold storages is highly uneven with majority of the cold storages located in Uttar Pradesh, Gujarat, Punjab and Maharashtra. Further nearly two thirds of the total cold storage capacity is used for horticulture crops including potato. Despite the storage capacity, the Central Institute of Post-Harvest Engineering and Technology estimates that close to 15 per cent-16 per cent of fruits and vegetables perish as cold storages are located near consumption centres rather than farms. The cold storage segment is driven by growth in trading of perishable products both agricultural and others (e.g. pharmaceutical).
Regulations
WDRA rules: Warehouses (especially agricultural) in India are regulated and governed under The Warehousing (Regulatory and Development) Act, 2007. The main objective of this Act is to develop and regulate warehouses, negotiability of warehouse receipts, establishment of Warehousing Development and Regulatory Authority (WRDA) and for related matters.
Registration: The act makes it compulsory for a person to carry on warehousing business as a business and issue a negotiable receipt to obtain a certificate of registration.
Warehousing receipt: The warehouse would issue receipts only after ascertaining quantity, quality / grade and other particulars as may be mentioned in the receipts.
Authority and Powers under the Act: Some of the authorities and powers conferred under the Act are granting registration and cancellation/renewal of registration, specifying qualification of warehouseman, and regulating rates, advantages, terms and conditions that may be offered by warehouseman in respect of warehousing business.
Offenses under the Act: Failing to ascertain quality and quantity, failing to surrender negotiable receipt by depositor or endorsee and payment of all his lawful charges and cancellation of encumbrances endorsed on the receipt to deliver the goods represented by the receipt are some of the offences under the act.
Penalties: The offences committed under this Act shall be punishable with imprisonment of a term of up to three years or with fine of Rs 1,00,000 or both.
The industry also remains governed by various acts such as: Multimodal Transportation of Goods Act, 1993, Foreign Trade (Development and Regulation) Act, 1992, Customs Act, 1962, Carriage of goods law etc. regulating the movement of goods and allied services. Various policy changes have impacted the warehousing sector in India. These include the introduction of the Goods and Service Tax (GST), National Policy on Handling, Storage and Transportation, and increasing Public-Private Partnerships (PPP). Following are a few such policy measures:
GST: GST has consolidated the tax regime across states which will result in cost and time efficiencies across the supply chain. GST will also hasten the consolidation of warehouses thus accentuating the formalisation of the largely unorganised warehousing sector. For most logistics services like e-commerce logistics, warehousing and air freight (export), the tax rate is 18 per cent, which is an increase from the earlier rate of 15 per cent which includes service tax and cess. Services like ocean freight and road transportation are in the 5 per cent slab. Under GST, the tax on warehouse, storage and other labour services has increased from 15 per cent to 18 per cent.
Logistics Parks Policy: Launch of multi-modal logistics parks and the grant of "industry" status to the logistics sector.
Domestic manufacturing emphasis: The focus on "Make in India" is expected to increase domestic manufacturing and increase the requirement for associated activities such as warehousing.
Agri-warehousing activity covered under Priority Sector Lending by RBI Subsidy schemes such as 1) Grameen Bhandaran Yojana – a capital investment subsidy scheme offered by the NABARD, which ranges from 15 per cent to 33 per cent of project cost, depending on the location and operator, 2) National Agricultural Renewal Fund. Govt. of India – encourage private investment in the creation of agriculture infrastructure
Tax incentives such as 1) Tax relief under 80(I)(B): tax holiday on warehousing income, 2) Investment-linked deduction under Section 35AD: 100 per cent upfront depreciation for tax purposes
The government permits 100 per cent FDI under the automatic route for all logistics services except courier and air transportation services. In case of courier services, 100 per cent FDI is permitted subject to the approval of the Foreign Investment Promotion Board (FIPB) while FDI up to 74 per cent is permitted under the automatic route for air transport services including air cargo services. Further according to media reports, the government is working on a policy to create new logistics hubs by preparing an integrated logistics plan. The new integrated logistics plan would be prepared by the logistics division in the department of commerce in consultation with various stakeholders.
Trends
Warehouse consolidation due to GST: With the advent of GST and the consequent redrawing of supply chains, there will be significant consolidation of warehouses by companies in the consumption space. A bigger warehouse in an appropriate location would be able to better serve a larger area. This will lead to development of large modern technology based warehousing operations and rapid modernisation of unorganised godowns. Smaller local developers and property owners are expected to exit the space by selling out to the large institutional developers in existing clusters.
Reduction in inventory holding costs: Further the combining of smaller warehouses into a single larger one is also expected to reduce the inventory level requirements which are expected to positively impact the companies as inventory carrying cost is a significant share of costs.
Smart warehouses: With the increase in the warehousing and storage market there has been a concurrent increase in technology usage especially in the grade A/B warehouses. These warehouses use internet of things (IOT) to track a product in the warehouse and also helps in increasing efficiency and speed across supply chains. Variety of devices such as wearables, sensors and radio frequency identification tags are used to locate the products in the warehouse. This reduces the time to deliver the product to the customer and increases accuracy.
Rise of Direct Port Delivery (DPD): DPD involves the delivery of a shipment directly from a port to the consignee instead of initially holding it at a CFS (Container Freight Station). The DPD initiative under "Ease of Doing Business" has witnessed steady growth in terms of proportion of total containers handled. At JNPT, the share of Direct Port Delivery (DPD) has increased from 5.4 per cent in April 2016 to 39.2 per cent March 2018. This is likely to have an impact on the CFS. However, shortage of space at warehouses poses a challenge to service DPD clients efficiently.
High tonnage trucks sales are expected to rise: Supply chain realignment and check post discontinuation has led to a reduction in the travel time as well as fuel costs. This has led to a demand for larger more efficient trucks as warehouses are consolidating and larger loads are required at lower number of locations. Despite the higher upfront costs, such trucks are expected to reduce overall shipment costs by carrying a larger load per trip.
Negotiable warehouse receipts
Negotiable Warehouse Receipts (NWR) issued by registered warehouses enables farmers to seek loans from banks against NWRs and enables them to extend the sales period of modestly perishable products beyond the harvesting season. Consequently, NWRs can avoid distress sale of agricultural produce by the farmers in the peak marketing season. However, NWRs have not witnessed substantial growth due to 1) low levels of registered warehouses with WDRA, 2) minimal concession from banks for loans against NWRs, 3) presence of other collateral based lending entities, which do not require registration under WDRA.
Demand drivers for logistics
Emergence of MNCs and organised retail: One of the key demand drivers for the logistics industry has been emergence of MNCs and the share of organised retail has been increasing over the years. Most of the global MNCs prefer low cost manufacturing locations connecting the consuming market at the lowest possible cost and through highly efficient supply chain.
Emergence of 3PL and 4PL: Third party logistics or 3PL is a concept where a single logistics service provider manages the entire logistics function for a company. While the Indian 3PL market is still very much in its infancy compared with other countries, it is experiencing healthy growth and attracting new companies eager to capitalise on the plentiful opportunities it offers, In fourth party logistics 4PL, logistics is controlled by a service provider that does not own the assets to carry out logistics activities but outsources to subcontractors, the 3PL. 4PLs facilitate single-point reference for all logistics needs, possess knowledge of logistics to obtain most efficient and effective solutions, have manpower resources of higher quality to supervise vendors and ensure continuous process improvements and, above, all an IT base to network customer systems.
Robust trade growth: Post liberalisation there has been significant increase in economic growth which has led to an improvement in the domestic and international trade volumes. Consequently the requirement for transportation, handling and warehousing is growing at a robust pace and is driving the demand for integrated logistics solutions.
Globalisation of manufacturing systems: IT plays a key role in transportation and logistics industry. Today technology is present in all the areas for a logistics service provider. Technology helps organised logistics companies score over the unorganised ones, and will be key to their operations going ahead given the competition
Increasing investment in logistics parks: The concept of Logistics Park has gained attention from both public as well as private players. A large number of special economic zones have also necessitated the development of logistics centre for the domestic market as well as for trade purposes
Growth in the organised retail and the food processing sector is driving growth in the cold chain storage segment in India.
Challenges
Lower Standardisation: India’s logistics industry has been adversely affected by the lower standardisation of cargo and containerisation of logistics traffic, hampering the overall speed and thus increasing cost of storage and movement.
Need for large capital and issues related to land acquisition have also tempered the growth of the sector. However, with expected increase in investment by international players, the gap in funding requirement is expected to be addressed in the near future.
The industry revenue has grown at a modest CAGR of 2.5 per cent over the FY12 – FY17 period. Concurrently, the annual revenue growth rate has varied significantly over the same period. The companies generate the largest share of their revenues from rental i.e. storage charges; other sources of earnings include income from value added services such as such as sorting, packing, blending and processing. On the other hand, the key heads of expenses include employee costs, depreciation, SG&A costs, power & fuel costs and interest costs. Over the FY12-FY17 period, EBITDA margin has moved down as well as up ranging from a low of 7.2 per cent in FY14 to a high of 11 per cent in FY16 and declining to 10.1 per cent, while PAT margin has generally remained at around 2.5 per cent-4 per cent.
Although the debt levels of the companies have trended upwards, the debt to equity has generally remained stable, on the other hand, the interest coverage having peaked in FY15, has trended marginally downwards in the next two years. The decline in credit quality in the transportation and storage sector is on account of delays in debt servicing, liquidity constraints, decline in profitability and deterioration in the capital structure.
Outlook
CARE Ratings estimates that the warehousing industry will grow at a rate of 13-15 per cent in the medium term driven by the growth in manufacturing, retail, FMCG and ecommerce sector. Growth in overall production and consumption, organised retail, logistics outsourcing, and regulatory interventions such as WRDA Act and GST, private investments in logistics and other infrastructure developments such as Dedicated Freight Corridor (DFC) have also improved prospects of the organised professional warehousing segment. Further the implementation of GST is eliminating inefficiencies arising out of the erstwhile complex tax structure as well as interstate taxes.
Additionally, the government’s decision to allow FDI in retailing with emphasis on backend infrastructure such as modern warehousing space is also expected to provide further impetus to the sector.
Industrial warehousing is expected to grow due to various factors including the anticipated increase in global demand, growth in organised retail and increasing manufacturing activities, expansion of e-commerce options and growth in international trade. This segment is expected to witness significant activity as the presence of the unorganised segment which is dominant in the segment is also expected to significantly reduce and the companies would also be rationalising and consolidating their space requirements based on time to serve the market and not taxation.
Demand for agriculture warehousing is expected to grow moderately on account of high base and expected normal monsoons.
Integrated models, diversification across end-user industries are expected to drive growth of cold chain segment. Significant demand is also seen coming from storage of fruits and vegetables, and pharmaceutical segments.
The container freight station (CFS)/ inland container depot (ICD) industry although on a growth curve is expected to be under pressure due to the growth of Direct Port Delivery (DPD) and profitability is expected to be hampered with the anticipated loss of volumes and consequential lower utilisation.
However, the overall growth potential is limited by several key challenges like limitations in infrastructure connectivity, need for large capital and issues related to land acquisition which would need to be addressed for ensuring sustainable growth.
Source: CARE Ratings’ Industry Research on Overview of the India Warehousing Industry
India’s first multi-modal terminal on inland waterways! Prime Minister Narendra Modi inaugurated India’s first multi-modal terminal on the Ganga river in his parliamentary constituency and received the country’s first container cargo transported on inland waterways from Kolkata.
This is the first of the four multi-modal terminals being constructed on the National Waterway-1 (River Ganga) as part of the World Bank-aided "Jal Marg Vikas Project" of the Inland Waterways Authority of India. The total estimated cost of the project is Rs 5,369.18 crore, which will be equally shared between the Government of India and the World Bank. Its objective is to promote inland waterways as a cheap and an environment-friendly means of transportation, especially for cargo movement. The Inland Waterways Authority of India (IWAI) is the project implementing agency. The project entails construction of three multi-modal terminals (Varanasi, Sahibganj and Haldia), two inter-modal terminals, five roll-on-roll-off (Ro-Ro) terminal pairs, new navigation lock at Farakka, West Bengal, assured depth dredging, integrated vessel repair and maintenance facility, differential global positioning system (DGPS), river information system (RIS) and river training.
Disclaimer:
This report is prepared by CARE Ratings Ltd. CARE Ratings has taken utmost care to ensure accuracy and objectivity while developing this report based on information available in public domain. However, neither the accuracy nor completeness of information contained in this report is guaranteed. CARE Ratings is not responsible for any errors or omissions in analysis/inferences/views or for results obtained from the use of information contained in this report and especially states that CARE Ratings has no financial liability whatsoever to the user of this report.

You may like


Indian Cement Review (ICR) and Fuller Technologies brought industry, policy and technology leaders together to discuss how cement innovation can drive green construction at scale, writes Rakesh Rao.
India is building at a pace few countries can match. Highways, airports, housing, logistics parks, industrial corridors and urban infrastructure are reshaping the country’s economic geography. But beneath this growth story lies a difficult question: can India continue to build at scale without locking itself into a high-carbon future?
That question formed the core of an online panel discussion titled “Driving Green Construction Through Cement Innovation”, organised by Indian Cement Review (ICR) in association with Fuller Technologies as the Presenting Partner on June 25, 2026. The webinar brought together experts from cement technology, R&D, global industry platforms, building performance policy and international development cooperation to examine how low-carbon cement and material innovation can accelerate India’s green construction transition.
The discussion came at a crucial time. India has committed to achieving net-zero emissions by 2070 and reducing the carbon intensity of its economy by 45 per cent by 2030. At the same time, the country’s construction sector is expanding rapidly, driven by urbanisation, infrastructure development, housing demand and industrial growth. Cement, as one of the most widely used construction materials, sits at the heart of this transition. It is indispensable to development, but also central to the challenge of reducing embodied carbon in buildings and infrastructure.
Moderated by Nitika Krishan, Senior Urban Infrastructure and Sustainable Policy Consultant, the panel featured:
- Kiranmai Sanagavarapu, Director, Low Carbon Solutions, Fuller Technologies;
- Dr Hemantkumar Aiyer, VP and Head R&D, Nuvoco Vistas Corp Ltd;
- Devika Wattal, Innovation Lead, Global Cement and Concrete Association (GCCA);
- Dr Sunita Purushottam, MD, GBPN India (Global Buildings Performance Network); and
- Vaibhav Rathi, Senior Technical Advisor, GIZ (the German Agency for International Cooperation)
Setting the tone for the discussion, Nitika Krishan underlined the scale of the challenge before the sector. “The question before us is no longer whether we build, but how we build sustainably,” she said. She pointed out that construction accounts for nearly 40 per cent of global energy-related carbon emissions when both operational and embodied carbon are considered. Cement production, she added, remains one of the hardest industrial processes to decarbonise.
For India, this is not merely an environmental issue. It is a development issue, a competitiveness issue and increasingly, a market issue. As one of the world’s largest cement producers and among the fastest-growing construction markets, India’s material choices will influence the carbon trajectory of its built environment for decades. As Krishan observed, sustainability solutions in economies such as India must not remain limited to laboratory success. They must be scalable, commercially viable and practical at national level.
The innovation gap: From technology to market
Experts believe that there is a need to bridge the innovation gaps for making decarbonisation in cement and concrete scalable. Devika Wattal of GCCA, explained, “The starting point must be the core cement manufacturing process itself. The first and foremost is the heart of our process, the heart of cement manufacturing. How do we reduce clinker? That is always a topic where industry is working very intrinsically.”
Clinker reduction remains one of the most important pathways for lowering emissions in cement. Since clinker production is energy-intensive and chemically emits carbon dioxide, reducing the clinker factor through supplementary cementitious materials (SCMs), blended cements and new chemistries can have a significant impact. Wattal also noted that carbon capture, utilisation and storage (CCUS) will have a role, though it may not be the first lever for all markets.
However, she stressed that innovation cannot stop at technology development. A solution that works in the lab must also be adaptable to industry, scalable in production and acceptable in construction practice. “It is important for that innovation to be adaptable, to be scalable, and so that it can be executed in real time,” she said.
Wattal also called for stronger enabling systems around innovation. These include performance-based standards, product-level embodied carbon databases and clearer frameworks for evaluating green materials. Without these, low-carbon cement products may struggle to compete with conventional materials in procurement and design.
R&D must balance carbon, cost and performance
Bringing in the R&D perspective into the discussion, Dr Hemantkumar Aiyer of Nuvoco Vistas emphasised that low-carbon cement development cannot be treated as a single-variable exercise. Cement must perform in real construction conditions. It must deliver strength, durability, consistency and cost competitiveness, while also reducing carbon.
“The root of understanding and balancing all these aspects lies in materials, and knowing the materials,” he said.
According to Dr Aiyer, R&D teams must understand the variability of raw materials such as fly ash, slag and clinker. Different sources produce different material behaviours. This makes mix optimisation, material characterisation and processing-property relationships critical. When performance is affected, cement manufacturers must understand how strength enhancers, admixtures and other performance chemicals interact with the material system.
He also linked material science with process efficiency. Clinkerisation takes place at extremely high temperatures, around 1,400 to 1,450 degrees Celsius. Any improvement in raw mix design, process control or energy optimisation can, therefore, help reduce emissions and cost. Dr Aiyer pointed to artificial intelligence-based optimisation, Cement 4.0 tools and advanced software as important enablers for real-time process and material control.
“The more you understand the materials, the more you can control it,” he said.
LC3: The promise is proven, the sequencing is not
Limestone calcined clay cement, commonly referred to as LC3, has attracted global attention because it can reduce clinker content significantly by using calcined clay and limestone while maintaining performance in many applications. Kiranmai Sanagavarapu of Fuller Technologies said the technology itself has already moved beyond proof of concept. Fuller Technologies has worked with calcined clay technology for nearly two decades and has seen plants running in France and Ghana. These plants, she said, are meeting local and national specifications, while the economics are beginning to make sense.
“The calciner is performing, the economics is stacking up, it is making business sense to produce,” she said.
But if the technology is viable, why has adoption not scaled faster? For Sanagavarapu, the answer lies in project sequencing. Too often, clay characterisation happens after equipment is specified. This, she warned, is a backward approach because calciner design depends on clay mineralogy, kaolinite content, iron levels, reactivity, moisture and other variables.
“If you don’t know what your deposit looks like before you commit for the equipment, you are, in a way, going blind into designing,” she said.
She also identified permitting and plant integration as major bottlenecks. Environmental clearances, mining permissions and local regulatory approvals must begin early. Similarly, calcined clay must be integrated into existing grinding, blending and logistics systems from the design stage, not treated as an afterthought during commissioning.
India already has IS 18189:2023 standard for LC3, but Sanagavarapu pointed out that the standard is not yet visible enough in procurement documents. “The gap between what is technically being permitted and what the procurement is asking is the single biggest bottleneck,” she said.
In her view, successful scale-up depends on getting the sequence right: clay characterisation first, permitting in parallel, standards aligned with construction, and integration built into plant design.
India’s LC3 journey: Progress, but demand remains thin
Providing details of India’s LC3 commercialisation experience, Vaibhav Rathi of GIZ noted that JK Cement carried out the first commercial production of LC3 at its Rajasthan plant, followed by JK Lakshmi Cement three months later. These initiatives were supported by the International Climate Initiative of the Government of Germany, with IIT Delhi contributing deep institutional knowledge on LC3 research and BIS certification.
Rathi said India’s early experience has produced clear lessons. One of the biggest was the need to build capacity among regulators. While BIS certification existed, State Pollution Control Boards were unfamiliar with the technology and unsure about the approval pathway.
“The capacity building is not just needed amongst the producer and the users of the cement, but also the regulators who are working with this technology for the first time,” he said.
He also highlighted the need for better information on China clay deposits. Since China clay is currently classified as a minor mineral, centralised data on availability, quality and location is limited. If cement manufacturers are to adopt LC3 at scale, stronger mineral intelligence will be important.
The third issue is demand. LC3 has already been used in projects such as Palava City in Mumbai and Noida International Airport, but these remain limited examples. “It is in a chicken and egg situation,” Rathi said. “Cement companies are saying we need more demand, and users are saying there is not enough cement available.”
Public procurement, he suggested, could help break this cycle. If agencies such as CPWD and other public bodies begin testing, accepting and specifying LC3, it could create the market confidence needed for cement companies to invest in production and storage.
Building codes must catch up with innovation
Dr Sunita Purushottam of GBPN India argued that material choices will determine built environment emissions over the long term, but India’s current policy signals remain fragmented. Although LC3 has received BIS recognition, she pointed out that building codes, municipal bylaws, schedules of rates and sustainability codes do not yet provide uniform guidance on low-carbon cement.
“The current cement regulations are largely prescriptive and favouring traditional materials,” she said. This limits the ability of alternative materials to compete on performance, durability and emissions.
Dr Purushottam also raised the issue of taxation. Cement, including LC3, currently falls under the same GST bracket as conventional cement. A differentiated tax structure, she argued, could help accelerate market adoption. “In order for the market to demand LC3, that differentiation in the GST could go a long way,” she said.
She noted that green building certifications such as IGBC and GRIHA are already creating demand for low-carbon materials by assigning points for embodied carbon and sustainable material use. However, she said large-scale adoption will require regulatory mandates, particularly through building codes and state-level notifications.
She also cautioned that low-carbon cement alone does not solve the entire building performance problem. A material may reduce embodied carbon, but the operational carbon of a building depends on thermal performance, design, insulation and energy use. “The energy part has two elements,” she said. “One is the embodied carbon of the material itself, and the other is the operational carbon.”
Collaboration is the bridge between invention and impact
Wattal said GCCA sees innovation as a strategic priority and works through platforms that connect industry with academia and start-ups. “There is no way we will decarbonise our sector without innovation,” she said.
However, she stressed that research must be connected to actual industry challenges. Innovations developed in isolation may fail when they encounter real-world barriers such as raw material variability, plant integration, cost, standards and finance. Start-ups, too, need industry mentorship and scale-up pathways.
Wattal also flagged the importance of finance. Even strong technologies may struggle to attract investment if there is no common understanding of bankability. “We have always put projects into, is this a bankable project? But the definition of a bankable project has never been defined,” she said.
For India, she saw strong potential in its academic and start-up ecosystem, but said the challenge lies in alignment and prioritisation. The country has the research base, industrial capacity and market size. What it now needs is a coordinated route from innovation to deployment.
There is a practical concern for cement manufacturers: how can existing plants be adapted for lower emissions without compromising reliability or commercial viability?
Kiranmai Sanagavarapu addressed, “The reliability risk in calcined clay retrofit is definitely real, but it is almost always self-inflicted. The risk arises when a new process is added to an existing circuit without properly redesigning grinding and blending configurations.”
Existing cement plants, she explained, can take two broad routes. The first is external sourcing of calcined clay combined with mill optimisation. This requires lower capital investment and can potentially move in 12 to 18 months if other conditions are in place. It may reduce emissions by around 20 to 30 per cent. The second route is integrated calcination on site, which requires higher capital expenditure and longer lead times, but provides greater control over quality, supply and emissions reduction potential.
For Sanagavarapu, the principle is simple: low-carbon retrofits must be designed with intent. “Design it with an intent properly from the start. Start in the market conditions where the economics are already working,” she said.
Circularity: The overlooked advantage
According to Vaibhav Rathi, fly ash and slag are already well established in cement and construction (C&D), but construction and demolition waste remains underutilised. “C&D waste is a growing business opportunity which not many have taken up,” he said. India’s continuous construction and demolition activity creates huge volumes of waste, much of which contributes to air pollution, land degradation and material inefficiency. With the right processing and standards, this waste can be converted into useful construction products.
Rathi also pointed out that LC3 has a circular economy dimension that is often overlooked. It can use low-grade kaolin-rich clay left behind after high-grade clay is extracted for other applications. “LC3 is not only a low-carbon solution, but also a circular economy solution,” he said.
At the same time, he cautioned that LC3 in India is not yet cheap because it has not reached scale. Site-specific techno-commercial feasibility studies, supported jointly by development agencies and industry, could help companies assess whether LC3 production makes technical and financial sense at a given location.
Dr Purushottam added that India must address both low-carbon cement and construction waste together. “Both low-carbon cement and C&D waste go hand in hand. India does not have an option but to work on both,” she said.
Dr Aiyer called for policy shifts from both government and industry, including preferential purchasing of sustainable materials, minimum supplementary cementitious material requirements in public and public-private projects, and faster regulatory implementation. “If we can fast-track the regulatory standards and their implementation on the ground, that is the way to go,” he said.
From green ambition to green construction
Cement innovation is no longer only about chemistry. It is about systems. Low-carbon cement will scale only when technology, standards, procurement, finance, regulation, education and construction practice move together.
LC3 and other low-carbon technologies have shown promise. India has early commercial examples, strong research capability and growing market interest. But mainstream adoption will depend on whether demand can be created, regulators can be capacitated, standards can be embedded in procurement, and manufacturers can see a clear business case.
For a country building at India’s scale, the opportunity is enormous. Cement will continue to be central to infrastructure and urban development. The challenge now is to ensure that the cement used in India’s growth story carries a lower carbon burden.
- Rakesh Rao
Participate in Cement Expo 2026 and discover how next-gen infrastructure can be built with innovations in cement.
Concrete
Indian Railways Plans Green Fly Ash Transport Network
Published
2 weeks agoon
June 27, 2026By
admin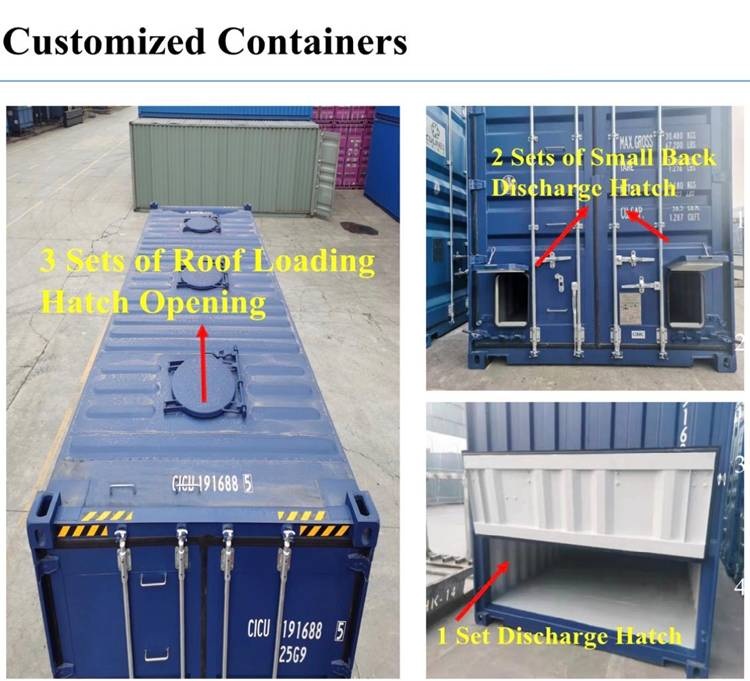
Specialised rail logistics will move fly ash from power plants to infrastructure industries.
New Delhi
Indian Railways is planning a large-scale green logistics initiative to transport fly ash from thermal power plants to industries where it can be reused in infrastructure and construction activities.
The initiative was discussed during a review meeting chaired by Union Minister for Railways Ashwini Vaishnaw. Union Ministers of State for Railways V Somanna and Ravneet Singh Bittu were also present.
India generates nearly 340 million tonnes of fly ash every year from thermal power plants. The proposed initiative aims to create an efficient rail-based transport system using specialised containers and dedicated logistics arrangements to move fly ash safely from power plants to end-use industries.
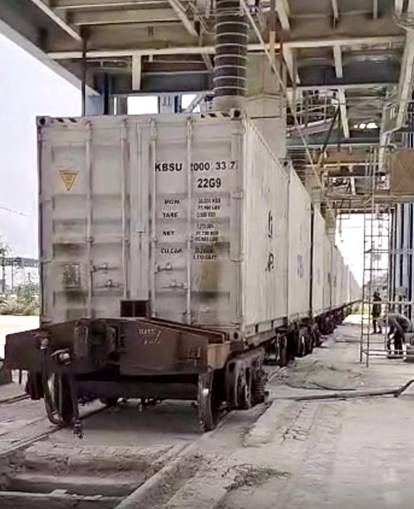
Fly ash is widely used in road construction, cement manufacturing, brick production, concrete, blocks and boards. By improving its movement through the railway network, the initiative is expected to support better utilisation of this industrial by-product while reducing environmental concerns linked to storage and disposal.
The move also aligns with India’s circular economy goals by converting waste from thermal power generation into a useful raw material for the construction and infrastructure sectors. Wider availability of fly ash can help reduce material costs in areas such as bricks and cement, supporting more affordable infrastructure and housing development.
Through this initiative, Indian Railways aims to provide a cleaner, safer and more organised transport solution for fly ash, turning an environmental challenge into an infrastructure resource.

Gears, drives, and motors have evolved from essential mechanical components into strategic enablers of reliability, efficiency, and sustainability in modern cement plants. ICR explores how advanced motion technologies, predictive maintenance, digitalisation, and intelligent drive systems are helping cement manufacturers reduce downtime, optimise energy use, and build future-ready operations.
As the Indian cement industry prepares for another phase of capacity expansion, the focus is shifting from merely increasing production volumes to improving operational efficiency, reliability, and sustainability. According to industry estimates, India is expected to add nearly 160–170 million tonnes of cement capacity between FY26 and FY28, driven by infrastructure investments, urbanisation, and housing demand. In this environment, gears, drives, and motors have emerged as critical enablers of productivity, forming the backbone of every major process from raw material extraction and grinding to clinker production and cement dispatch.
Motors alone account for nearly 60 per cent to 70 per cent of industrial electricity consumption globally, according to the International Energy Agency (IEA), while rotating equipment failures remain among the leading causes of unplanned downtime across heavy industries. In cement plants, where equipment operates under high loads, extreme dust conditions, elevated temperatures, and continuous-duty cycles, the performance of gears, drives, and motors directly influences energy consumption, maintenance costs, plant availability, and overall profitability. As digitalisation and Industry
4.0 technologies gain momentum, these systems are evolving from passive mechanical components into intelligent assets capable of delivering real-time operational insights.
Why gears, drives, and motors are the backbone of cement plant operations
Every major process in a cement plant depends on the seamless operation of gears, drives, and motors. Raw mills, vertical roller mills, crushers, kiln drives, conveyor systems, fans, and clinker coolers all rely on rotating equipment to maintain continuous production. A failure in any one of these systems can disrupt entire process chains, highlighting their strategic importance.
Modern cement plants process thousands of tonnes of material daily, requiring equipment capable of transmitting enormous torque while maintaining precision and reliability. Kiln drives and grinding systems, in particular, operate under some of the highest mechanical loads found in industrial manufacturing. The ability of gears and motors to withstand these conditions directly impacts plant throughput and production stability.
Satish Maheshwari, Chief Manufacturing Officer, Shree Cement says, “Effective lubrication management remains one of the most critical factors in extending the lifespan of cement plant drive systems. Proper lubrication, supported by regular oil analysis, vibration diagnostics, and condition monitoring, helps minimise wear, prevent unexpected failures, and maintain the integrity of critical components such as gearboxes, motors, and drive assemblies. By identifying potential issues at an early stage, plants can move from reactive maintenance to a more proactive and reliability-focused approach.”
“Smart motors, intelligent drives, and next-generation gearboxes are set to redefine cement plant maintenance and performance. Equipped with embedded sensors, IoT connectivity, digital twins, and AI-driven diagnostics, these technologies enable real-time condition monitoring, predictive maintenance, and seamless digital integration. As the industry embraces Industry 4.0, smart drive systems will play a pivotal role in improving energy efficiency, reducing downtime, and optimising asset performance across the cement manufacturing value chain” he adds.
Industry studies suggest that rotating equipment accounts for a significant proportion of maintenance expenditure in process industries. Effective design, selection, and maintenance of gears, drives, and motors therefore have a direct influence on asset utilisation, operational efficiency, and total cost of ownership.
The cost of downtime: reliability challenges in rotating equipment
Unplanned downtime remains one of the most expensive challenges facing cement manufacturers. Industry estimates indicate that a major failure involving a critical gearbox, kiln drive, or grinding mill can result in production losses running into lakhs of rupees per hour, depending on plant capacity and operating conditions.
Sanjeev Arora, President – Motion Business & IEC LV Motors Division, ABB India says, “One of the most significant shifts taking place in industrial decision-making today is moving away from evaluating equipment based solely on upfront capital cost toward understanding total cost of ownership (TCO). In a typical motor system, the purchase price often represents only a small fraction of the total lifecycle cost however energy consumption, maintenance requirements, downtime and operating efficiency account for the vast majority of long-term operational expenses. For cement manufacturers operating in highly competitive markets, this distinction is critical.”
“A high efficiency motor paired with an appropriately configured variable speed drive may require a higher initial investment, but the long-term benefits are substantial. Reduced electricity consumption, lower maintenance needs, longer service intervals and improved process stability can deliver faster payback and stronger profitability over time” he adds.
Cement plants present a particularly challenging environment for rotating equipment. Dust ingress, thermal fluctuations, shock loads, vibration, shaft misalignment, and lubrication contamination contribute significantly to equipment degradation. Studies by SKF indicate that nearly 50 per cent of bearing failures are linked to lubrication issues and contamination, while improper alignment and vibration-related problems remain leading causes of gearbox and motor failures.
Energy-efficient motors and drives: unlocking operational savings
Energy is one of the largest operating expenses for cement manufacturers, often accounting for 25 per cent to 35 per cent of total production costs. Grinding operations alone can consume nearly 60 per cent to 70 per cent of a plant’s electrical energy, making energy-efficient motors and drives a strategic investment.
According to the International Energy Agency, high-efficiency motors combined with Variable Frequency Drives (VFDs) can reduce energy consumption by 20 per cent to 30 per cent in suitable applications. By matching motor speed and torque to actual process requirements, VFDs minimise unnecessary power consumption while reducing mechanical stress on equipment, improving both efficiency and reliability.
Advances in gearbox design and power transmission technologies
Modern gearbox technology has evolved significantly in response to the increasing demands of cement manufacturing. Advanced materials, case-hardened gears, optimised tooth profiles, improved surface finishing, and enhanced lubrication systems are helping reduce friction, wear, and thermal loading.
Girish Hanchate, Director – Industrial Market, India SKF India (Industrial) says, “Smart diagnostics are significantly improving the lifecycle of gears, motors, and other rotating equipment by enabling a shift from reactive maintenance to condition-based asset management. Hidden issues such as vibration anomalies, bearing defects, misalignment, and temperature fluctuations can quietly reduce plant throughput by 10 per cent to 20 per cent while increasing energy consumption long before a breakdown occurs. By leveraging advanced sensors, predictive analytics, machine learning, and real-time monitoring of vibration, temperature, and motor current, cement manufacturers can detect developing faults early, optimise maintenance schedules, and prevent costly secondary damage. This not only improves reliability but also supports energy efficiency and sustainability objectives.”
“The next major evolution in drive and bearing technology lies in the development of fully integrated smart mechanical ecosystems that combine high-performance bearings, advanced lubrication management, and digital intelligence. Sensor-enabled condition monitoring embedded directly within bearings and drive systems allows operators to capture critical operational data at the source, enabling predictive maintenance and real-time performance optimisation. Innovations such as SKF’s VA9A1 Spherical Roller Bearing series, engineered specifically for demanding cement applications such as crushers and kilns, demonstrate this trend. By increasing internal bearing space and optimising lubricant flow, these designs improve grease retention, reduce wear, minimise downtime, and create more resilient, energy-efficient rotating equipment systems for the future of cement manufacturing” he adds.
Manufacturers are increasingly focusing on compact, high-torque gearbox designs capable of delivering higher power density while maintaining service life. Innovations such as condition-monitored gear systems, improved sealing technologies, and modular gearbox architectures are simplifying maintenance while enhancing operational reliability.
Predictive maintenance, condition monitoring, and asset health management
The shift from reactive to predictive maintenance is transforming asset management across the cement industry. Technologies such as vibration monitoring, thermography, oil analysis, ultrasound testing, and motor current signature analysis are enabling operators to identify potential failures before they occur.
Research by Deloitte suggests that predictive maintenance can reduce breakdowns by up to 70 per cent and lower maintenance costs by 25 per cent. In cement plants, where shutdown windows are limited and equipment operates continuously, predictive maintenance offers a powerful tool for improving reliability and extending asset life.
Digitalisation, industry 4.0, and the rise of intelligent drive systems
Industry 4.0 technologies are redefining the role of gears, drives, and motors. Smart sensors embedded within motors, bearings, and gear systems can continuously monitor temperature, vibration, load, lubrication condition, and energy consumption.
Girish Hanchate says, “As the industry embraces automation, sustainability, and digital transformation, the importance of intelligent motion technologies will continue to grow. The convergence of advanced engineering, predictive maintenance, and Industry 4.0 solutions is creating a new generation of cement plants where reliability, efficiency, and sustainability work together to deliver long-term value. For cement manufacturers navigating increasing production demands and environmental expectations, investing in smarter gears, drives, and motors is no longer optional—it is a business imperative.”
Cloud-based monitoring platforms and Industrial Internet of Things (IIoT) architectures enable maintenance teams to access equipment health data remotely, improving visibility across geographically dispersed operations. Advanced analytics and
artificial intelligence are further enhancing fault detection capabilities, enabling more accurate maintenance planning.
The emergence of digital twins represents another significant development. By creating virtual replicas of physical assets, operators can simulate operating conditions, predict failures, optimise maintenance schedules, and improve lifecycle management decisions. These technologies are helping transform rotating equipment into intelligent assets that actively contribute to operational decision-making.
Building future-ready cement plants through smart motion technologies
The future of cement manufacturing will depend heavily on the ability to integrate mechanical reliability with digital intelligence. Smart motion technologies combine high-efficiency motors,
intelligent drives, condition monitoring systems, and automation platforms to create more responsive and efficient operations.
Sustainability goals are also accelerating investment in advanced motion technologies. Reduced energy consumption, improved equipment efficiency, and extended asset life contribute directly to lower carbon emissions and reduced resource consumption.
These benefits align closely with the industry’s decarbonisation objectives.
As capacity expansions continue across India, future-ready cement plants will increasingly prioritise reliability, flexibility, and data-driven decision-making. Organisations that successfully integrate smart motion technologies into their operations will be better positioned to reduce costs, improve productivity, and maintain a competitive advantage in a rapidly evolving market.
Conclusion
Gears, drives, and motors are no longer viewed solely as mechanical components; they have become strategic assets that influence every aspect of cement plant performance. Their reliability affects production continuity, their efficiency impacts operating costs, and their digital capabilities increasingly shape maintenance and operational strategies.
- –Kanika Mathur

Cement Prices To Hold Steady Amid Monsoon Slump

Cement Prices Set To Stay Under Pressure In July

TARIL Secures Ultra Mega Transformer Order From PGCIL

JK Cement Plans To Boost Capacity Utilisation And Premiumisation

India Hands Over 500 t Rice And 8500 t Cement To Seychelles
Cement Prices To Hold Steady Amid Monsoon Slump
Cement Prices Set To Stay Under Pressure In July
TARIL Secures Ultra Mega Transformer Order From PGCIL
JK Cement Plans To Boost Capacity Utilisation And Premiumisation